Copyright
©The Author(s) 2015.
World J Gastroenterol. Oct 21, 2015; 21(39): 11127-11140
Published online Oct 21, 2015. doi: 10.3748/wjg.v21.i39.11127
Published online Oct 21, 2015. doi: 10.3748/wjg.v21.i39.11127
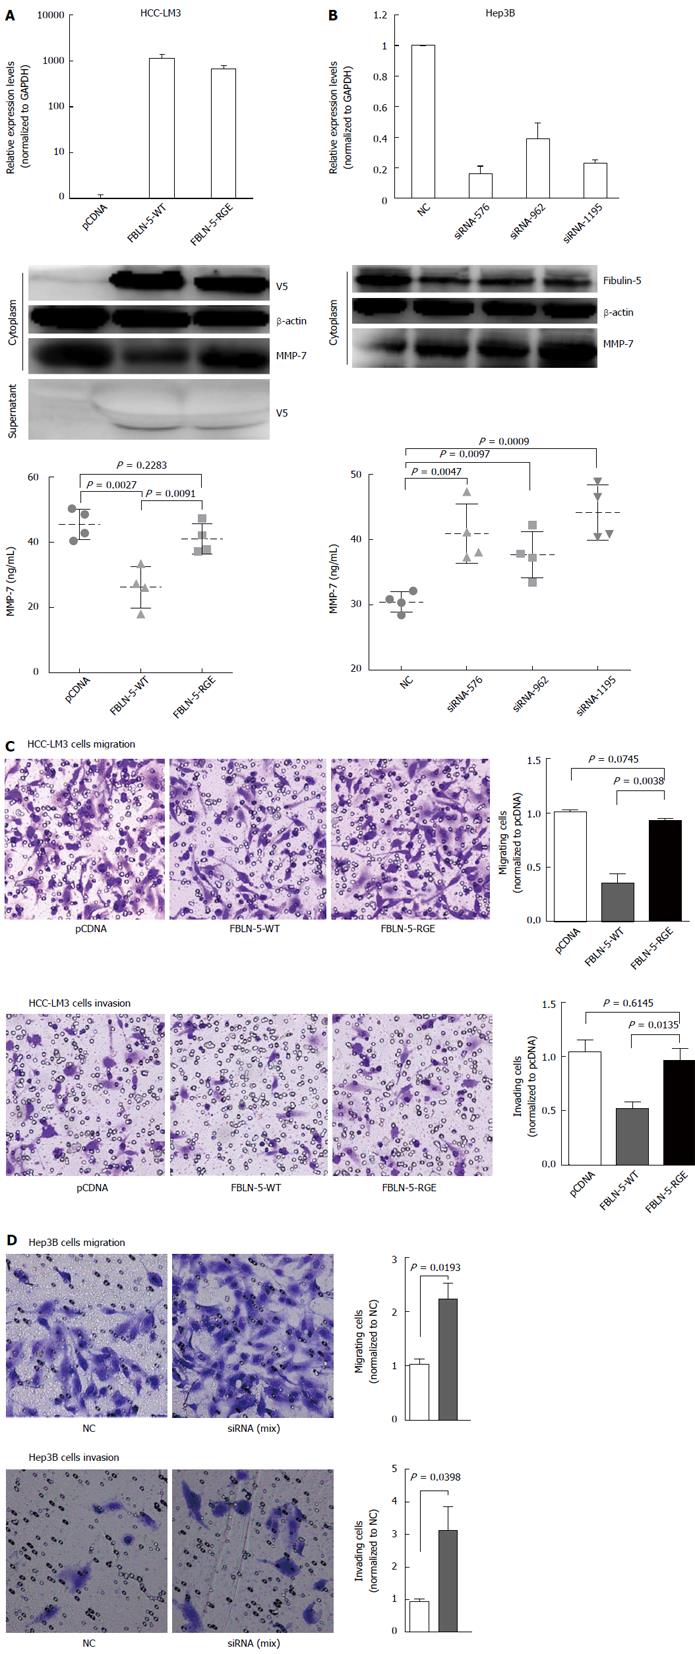
Figure 5 RGD-dependent suppression of hepatocellular carcinoma cell migration and invasion by fibulin-5 via matrix metalloproteinase 7.
A: V5-tagged fibulin-5 (FBLN-5) was transfected into hepatocellular carcinoma (HCC)-LM3 cells, and V5-FBLN-5 expression was determined by Western blot with anti-V5 and anti-β-actin antibodies both in the cytoplasm and supernatant. The mRNA expression level of FBLN-5 was also measured by Q-RT-PCR. Matrix metalloproteinase 7 (MMP-7) expression was analyzed by Western blot 36 h after transfection. The levels of secreted MMP-7 were determined by ELISA (bottom) 36 h after transfection; B: A negative control siRNA (NC) plus FBLN-5 siRNA (siRNA-576, siRNA-962, siRNA-1195) was transfected into Hep3B cells for 48 h. After transfection, Western blot was performed with anti-FBLN-5 and β-actin antibodies. The mRNA expression level of endogenous FBLN-5 was also measured by Q-RT-PCR. MMP-7 expression was analyzed by Western blotting 36 h after transfection. The levels of secreted MMP-7 were determined by ELISA (bottom) 36 h after transfection; C: Migration and invasion of pcDNA-HCC-LM3, FBLN-5-WT-HCC-LM3 and FBLN-5-RGE-HCC-LM3 cells (× 100). For the migration assays, cells (pcDNA, FBLN-5-WT and FBLN-5-RGE) were seeded into the top of a transwell insert. After 24 h, the cells on top were scraped, and the cells that had migrated to the bottom were fixed and stained with crystal violet. The relative-fold migration values for the HCC-LM3 cells were normalized against the pcDNA and are represented diagrammatically. For the invasion assays, cells were seeded after the addition of matrigel. The relative-fold invasion values for the HCC-LM3 cells were normalized against the pcDNA and are represented diagrammatically; D: Migration and invasion results of NC and siRNA-FBLN-5 Hep3B cells are shown (× 100). The relative-fold migration and invasion values for siRNA-FBLN-5 transfected cells were normalized against the values for the NC and are represented diagrammatically. The results represent the mean ± SD of three independent experiments.
-
Citation: Tang JC, Liu JH, Liu XL, Liang X, Cai XJ. Effect of fibulin-5 on adhesion, migration and invasion of hepatocellular carcinoma cells
via an integrin-dependent mechanism. World J Gastroenterol 2015; 21(39): 11127-11140 - URL: https://www.wjgnet.com/1007-9327/full/v21/i39/11127.htm
- DOI: https://dx.doi.org/10.3748/wjg.v21.i39.11127


