Copyright
©The Author(s) 2015.
World J Gastroenterol. Oct 21, 2015; 21(39): 11127-11140
Published online Oct 21, 2015. doi: 10.3748/wjg.v21.i39.11127
Published online Oct 21, 2015. doi: 10.3748/wjg.v21.i39.11127
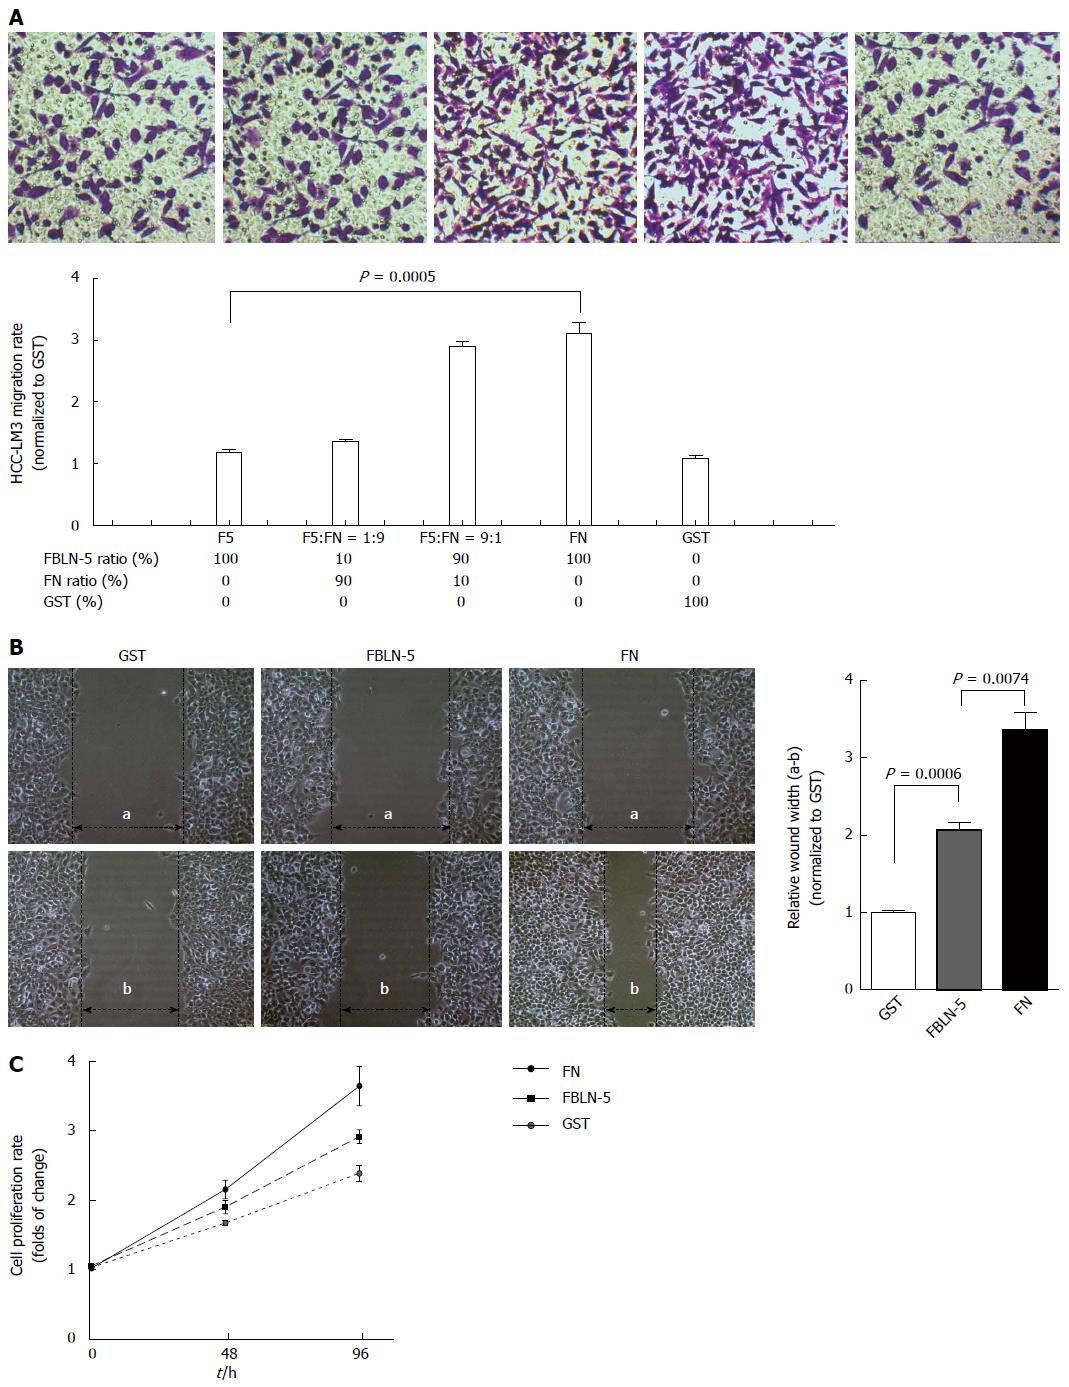
Figure 4 Hepatocellular carcinoma cell migration and proliferation on fibulin-5.
A: The effects on hepatocellular carcinoma (HCC)-LM3 migrating of Boyden chamber and transwell assays at a range of fibulin-5 (FBLN-5)/FN ratios (F5:FN) as indicated were analysed. HCC-LM3 cell migration was inhibited by FBLN-5 as compared with FN group (upper). The histogram (bottom) represent the migration rate after calculating the absorption of the destained cells at 590 nm. Results are mean ± SD of three experiments; B: Migration of HCC-LM3 cells on 200 nmol/L GST, FBLN-5 or FN. Monolayers were wounded and imaging at the leading edge was analyzed after 48 h of migration. Distances of wound width between 0 h (a) and 24 h (b) were counted and the mean ± SD is expressed as a percentage of cell migration by wound healing assays; C: The HCC-LM3 cell proliferation on GST (black dotted line), FBLN-5 (grey dashed line), FBLN-5 (black dashed line), and FN (black solid line) was investigated by CCK-8 assay. The y-axis represents the proliferation rate, calculated as the ratio to GST group (oh). Values are given as mean ± SD.
-
Citation: Tang JC, Liu JH, Liu XL, Liang X, Cai XJ. Effect of fibulin-5 on adhesion, migration and invasion of hepatocellular carcinoma cells
via an integrin-dependent mechanism. World J Gastroenterol 2015; 21(39): 11127-11140 - URL: https://www.wjgnet.com/1007-9327/full/v21/i39/11127.htm
- DOI: https://dx.doi.org/10.3748/wjg.v21.i39.11127


