Copyright
©The Author(s) 2015.
World J Gastroenterol. Oct 21, 2015; 21(39): 11127-11140
Published online Oct 21, 2015. doi: 10.3748/wjg.v21.i39.11127
Published online Oct 21, 2015. doi: 10.3748/wjg.v21.i39.11127
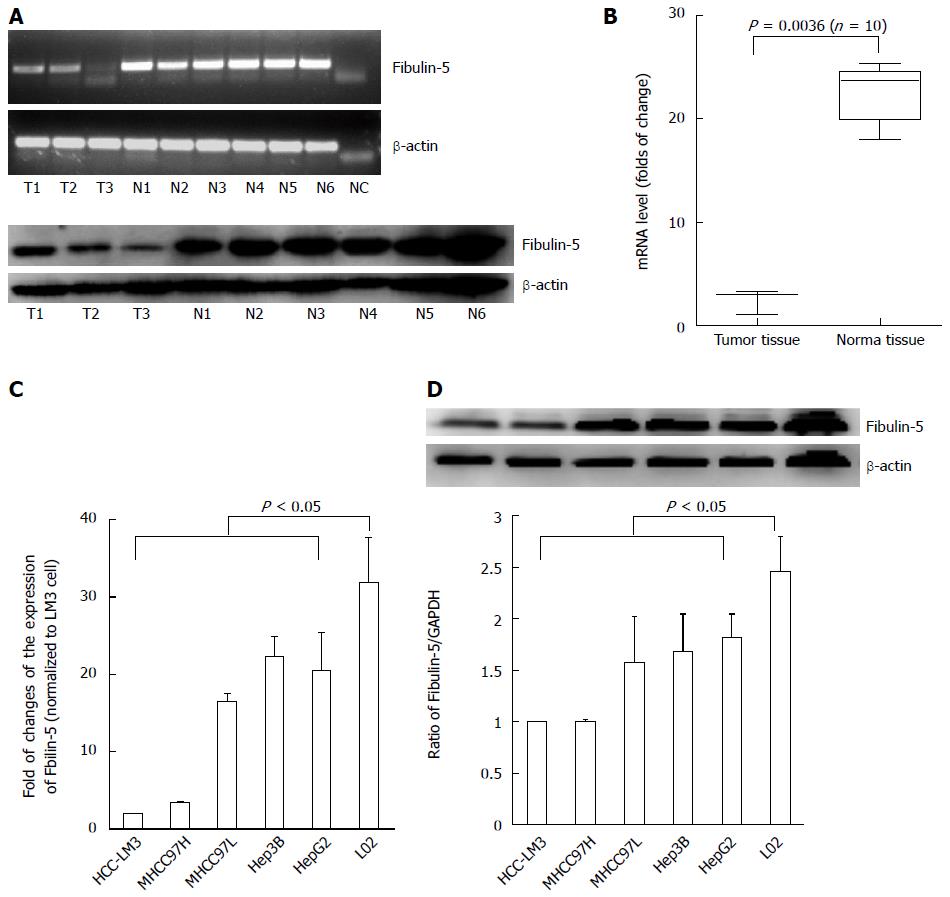
Figure 1 Decreased expression of fibulin-5 in hepatocellular carcinoma specimens.
A: RT-PCR and Western blot analyses of Fibulin-5 (FBLN-5) expression in three hepatocellular carcinoma (HCC) samples (T) compared to that in six normal tissues (N). β-actin was used as an internal control; B: Q-RT-PCR analysis of FBLN-5 expression in ten HCC samples compared to that in matched tumor-adjacent tissues. Values are given as the mean ± SD and analyzed by Student’s t-test; C: Comparing differences in the expression levels of FBLN-5 between HCC cell lines with different metastatic potentials and the immortalized hepatic cell line LO2 by Q-RT-PCR (P < 0.05 vs LO2, n = 3); D: Western blot analysis of FBLN-5 protein expression levels in HCC lines and LO2 cell line. The values of the band intensity below the figure represent the densitometric estimation of each band normalized by β-actin (P < 0.05 vs LO2, n = 3).
-
Citation: Tang JC, Liu JH, Liu XL, Liang X, Cai XJ. Effect of fibulin-5 on adhesion, migration and invasion of hepatocellular carcinoma cells
via an integrin-dependent mechanism. World J Gastroenterol 2015; 21(39): 11127-11140 - URL: https://www.wjgnet.com/1007-9327/full/v21/i39/11127.htm
- DOI: https://dx.doi.org/10.3748/wjg.v21.i39.11127


