Copyright
©The Author(s) 2015.
World J Gastroenterol. Oct 14, 2015; 21(38): 10840-10852
Published online Oct 14, 2015. doi: 10.3748/wjg.v21.i38.10840
Published online Oct 14, 2015. doi: 10.3748/wjg.v21.i38.10840
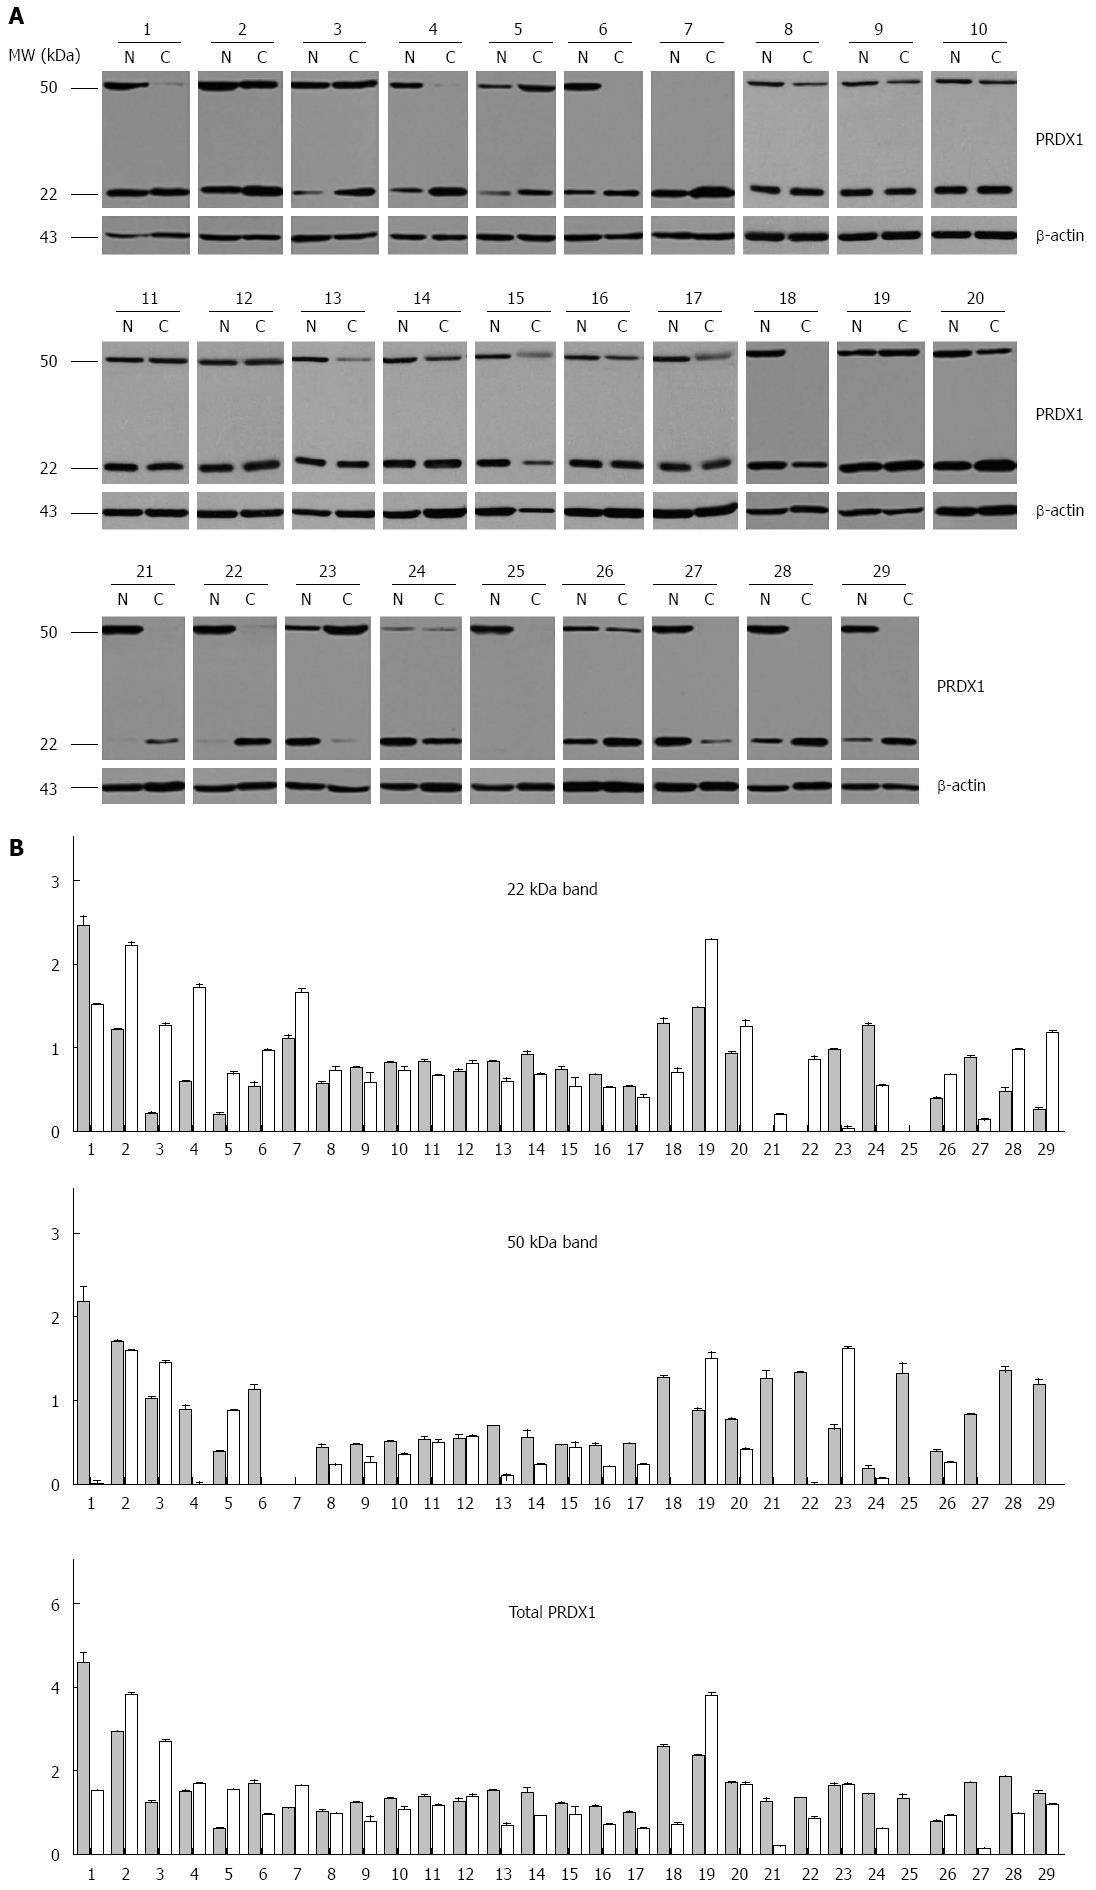
Figure 3 Expression of peroxiredoxin 1 in human liver cancer specimens.
A: Western blot analysis of tumor (C) and matching adjacent non-tumor liver tissues (N) of 29 patients. β-actin protein levels are shown as a loading control. The patients were coded from 1 to 29; B: Densitometric analysis of 29 hepatocellular carcinoma cases. The black and gray bars represent the relative band intensity of peroxiredoxin 1 (PRDX1) in non-tumor or tumor tissues, showing the ratio between 22 kDa, 50 kDa or total PRDX1 and β-actin. Each data point represents the mean ± SD derived from three independent experiments.
- Citation: Sun YL, Cai JQ, Liu F, Bi XY, Zhou LP, Zhao XH. Aberrant expression of peroxiredoxin 1 and its clinical implications in liver cancer. World J Gastroenterol 2015; 21(38): 10840-10852
- URL: https://www.wjgnet.com/1007-9327/full/v21/i38/10840.htm
- DOI: https://dx.doi.org/10.3748/wjg.v21.i38.10840


