Copyright
©The Author(s) 2015.
World J Gastroenterol. Sep 28, 2015; 21(36): 10385-10399
Published online Sep 28, 2015. doi: 10.3748/wjg.v21.i36.10385
Published online Sep 28, 2015. doi: 10.3748/wjg.v21.i36.10385
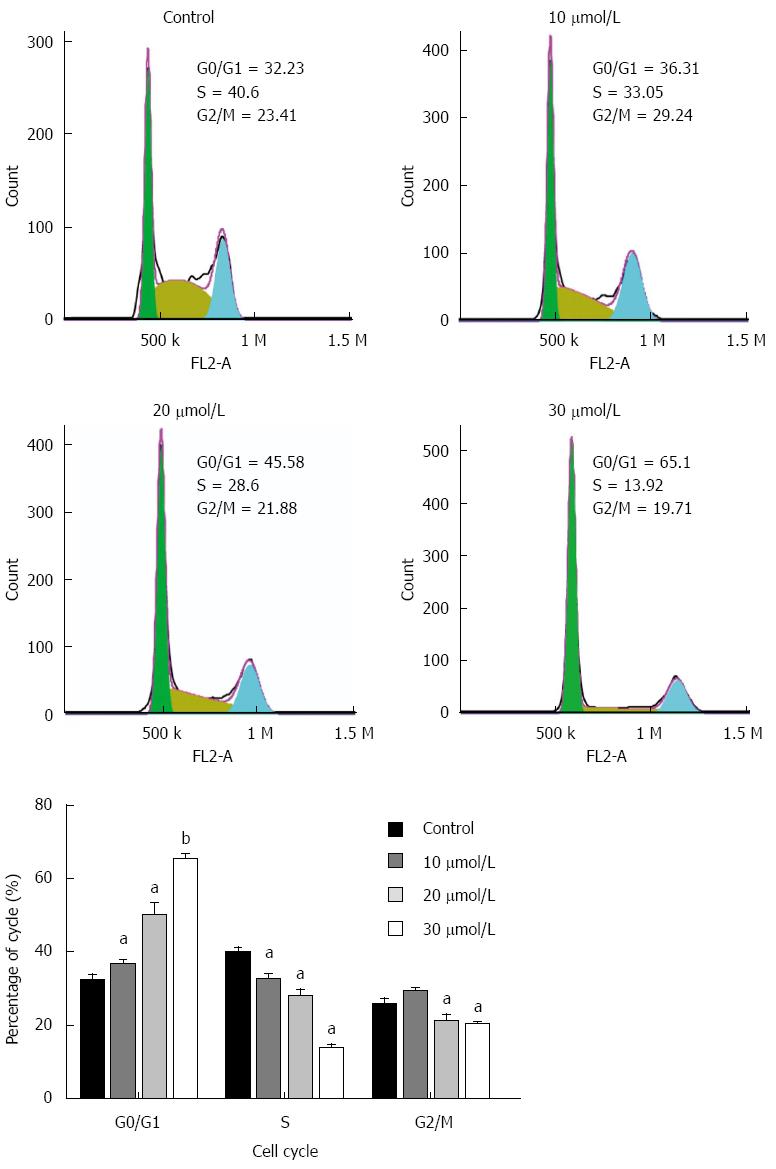
Figure 2 Cell cycle analysis of equol-treated cells.
MGC-803 cells were treated with various concentrations of equol for 24 h. The cell cycle distribution was determined by flow cytometry (aP < 0.05 vs control; bP < 0.01 vs control).
-
Citation: Yang ZP, Zhao Y, Huang F, Chen J, Yao YH, Li J, Wu XN. Equol inhibits proliferation of human gastric carcinoma cells
via modulating Akt pathway. World J Gastroenterol 2015; 21(36): 10385-10399 - URL: https://www.wjgnet.com/1007-9327/full/v21/i36/10385.htm
- DOI: https://dx.doi.org/10.3748/wjg.v21.i36.10385


