Copyright
©The Author(s) 2015.
World J Gastroenterol. Sep 21, 2015; 21(35): 10113-10125
Published online Sep 21, 2015. doi: 10.3748/wjg.v21.i35.10113
Published online Sep 21, 2015. doi: 10.3748/wjg.v21.i35.10113
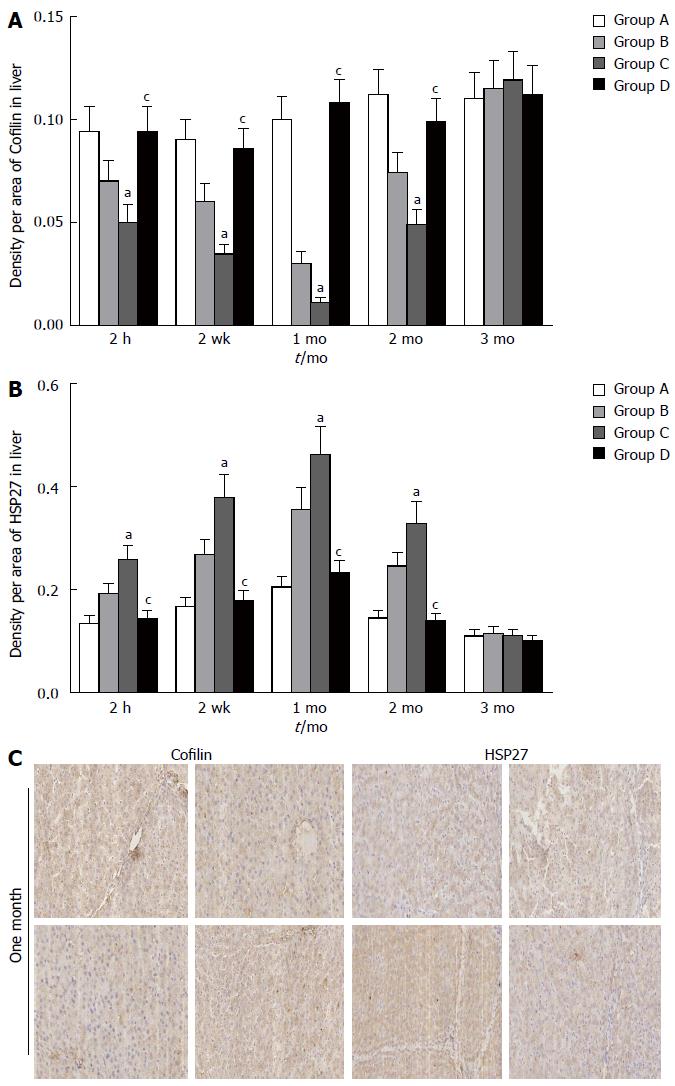
Figure 6 Comparison of the density values per area of cofilin and HSP27 in the liver.
A: Cofilin; B: HSP27; C: Immunohistochemical staining at 1 mo. Group A: Control group; Group B: Hepatic artery ischemia group (1 h); Group C: Hepatic artery ischemia group (2 h); Group D: Hepatic artery bridging group. aP < 0.05, cP < 0.05 vs Group B.
- Citation: Wang JZ, Liu Y, Wang JL, Lu L, Zhang YF, Lu HW, Li YM. Hepatic artery bridging lessens temporary ischemic injury to bile canaliculi. World J Gastroenterol 2015; 21(35): 10113-10125
- URL: https://www.wjgnet.com/1007-9327/full/v21/i35/10113.htm
- DOI: https://dx.doi.org/10.3748/wjg.v21.i35.10113


