Copyright
©The Author(s) 2015.
World J Gastroenterol. Sep 14, 2015; 21(34): 9999-10007
Published online Sep 14, 2015. doi: 10.3748/wjg.v21.i34.9999
Published online Sep 14, 2015. doi: 10.3748/wjg.v21.i34.9999
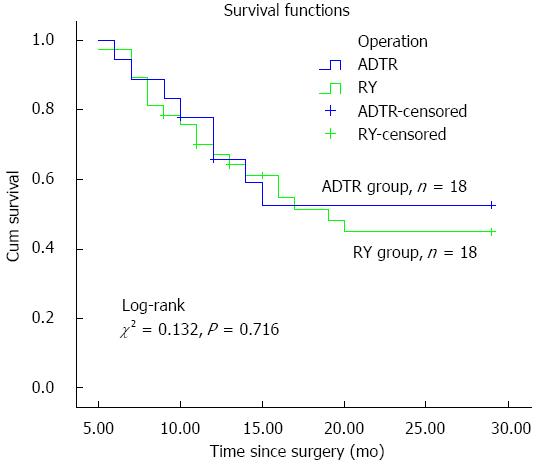
Figure 4 Kaplan-Meier graph showing overall survival in patients grouped according to operative procedure.
P = 0.716 between groups. RY: Roux-en-Y reconstruction; ADTR: Antrum-preserving double-tract reconstruction.
-
Citation: Xiao JW, Liu ZL, Ye PC, Luo YJ, Fu ZM, Zou Q, Wei SJ. Clinical comparison of antrum-preserving double tract reconstruction
vs roux-en-Y reconstruction after gastrectomy for Siewert types II and III adenocarcinoma of the esophagogastric junction. World J Gastroenterol 2015; 21(34): 9999-10007 - URL: https://www.wjgnet.com/1007-9327/full/v21/i34/9999.htm
- DOI: https://dx.doi.org/10.3748/wjg.v21.i34.9999


