Copyright
©The Author(s) 2015.
World J Gastroenterol. Sep 14, 2015; 21(34): 9993-9998
Published online Sep 14, 2015. doi: 10.3748/wjg.v21.i34.9993
Published online Sep 14, 2015. doi: 10.3748/wjg.v21.i34.9993
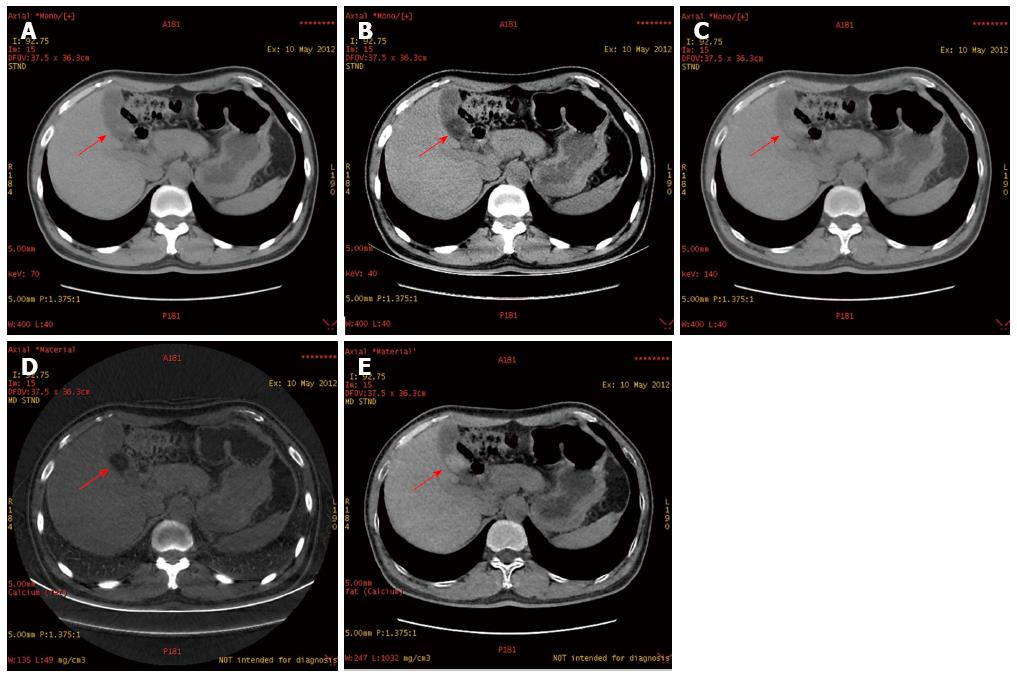
Figure 1 Gallbladder stones.
A: Gallbladder stone shown by the red arrow was not visualized at 70 keV (traditional polychromatic images); B: Gallbladder stone shown by the red arrow had a visible low-density stone shadow in 40 keV monochromatic images; C: Gallbladder stone shown by the red arrow was not visualized in 140 keV monochromatic images; D: Gallbladder stone shown by the red arrow had a visible low-density stone shadow in calcium base images. E: Gallbladder stone shown by the red arrow had a significant high-density stone shadow in lipid base images.
- Citation: Chen AL, Liu AL, Wang S, Liu JH, Ju Y, Sun MY, Liu YJ. Detection of gallbladder stones by dual-energy spectral computed tomography imaging. World J Gastroenterol 2015; 21(34): 9993-9998
- URL: https://www.wjgnet.com/1007-9327/full/v21/i34/9993.htm
- DOI: https://dx.doi.org/10.3748/wjg.v21.i34.9993


