Copyright
©The Author(s) 2015.
World J Gastroenterol. Sep 14, 2015; 21(34): 9957-9965
Published online Sep 14, 2015. doi: 10.3748/wjg.v21.i34.9957
Published online Sep 14, 2015. doi: 10.3748/wjg.v21.i34.9957
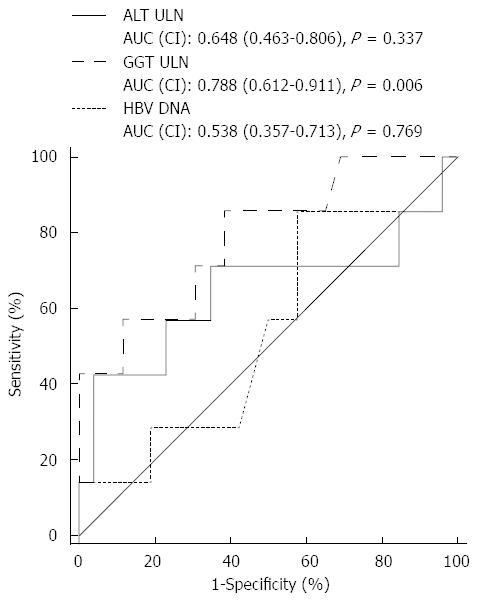
Figure 4 Receiver operating characteristic curves reveal baseline gamma-glutamyl transferase levels as a predictive marker for complete response in hepatitis B e antigen-positive patients following 48 wk of nucleos(t)ide analogue treatment.
Specificity and sensitivity values are plotted as a function of ALT, GGT, and HBV DNA levels. AUC is calculated with a 95%CI. ALT: Alanine aminotransferase; AUC: Area under the curve; CI: Confidence interval; GGT: Gamma-glutamyl transferase; HBV: Hepatitis B virus; ULN: Upper limit of normal.
- Citation: Huang R, Yang CC, Liu Y, Xia J, Su R, Xiong YL, Wang GY, Sun ZH, Yan XM, Lu S, Wu C. Association of serum gamma-glutamyl transferase with treatment outcome in chronic hepatitis B patients. World J Gastroenterol 2015; 21(34): 9957-9965
- URL: https://www.wjgnet.com/1007-9327/full/v21/i34/9957.htm
- DOI: https://dx.doi.org/10.3748/wjg.v21.i34.9957


