Copyright
©The Author(s) 2015.
World J Gastroenterol. Sep 14, 2015; 21(34): 9927-9935
Published online Sep 14, 2015. doi: 10.3748/wjg.v21.i34.9927
Published online Sep 14, 2015. doi: 10.3748/wjg.v21.i34.9927
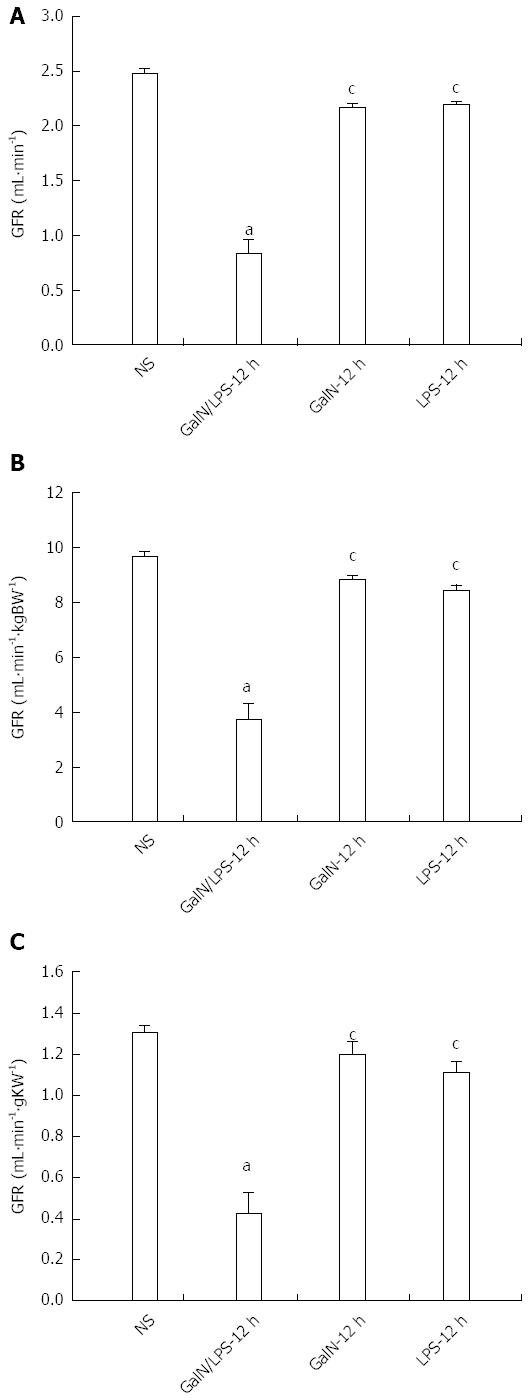
Figure 4 Comparisons of glomerular filtration rate for rats in each group.
A: GFR1 (mL·min-1); B: GFR2 (mL·min-1·kgBW-1); C: GFR3 (mL·min-1·gKW-1). GFR1, GFR2 and GFR3 decreased significantly in the GalN/LPS group compared with the NS, GalN and LPS groups (aP < 0.05 vs NS; cP < 0.05 vs GalN/LPS-12 h). D-GalN: D-galactosamine; LPS: Lipopolysaccharide; GFR: Glomerular filtration rate; NS: Normalsaline.
- Citation: Wang JB, Wang HT, Li LP, Yan YC, Wang W, Liu JY, Zhao YT, Gao WS, Zhang MX. Development of a rat model of D-galactosamine/lipopolysaccharide induced hepatorenal syndrome. World J Gastroenterol 2015; 21(34): 9927-9935
- URL: https://www.wjgnet.com/1007-9327/full/v21/i34/9927.htm
- DOI: https://dx.doi.org/10.3748/wjg.v21.i34.9927


