Copyright
©The Author(s) 2015.
World J Gastroenterol. Sep 14, 2015; 21(34): 9927-9935
Published online Sep 14, 2015. doi: 10.3748/wjg.v21.i34.9927
Published online Sep 14, 2015. doi: 10.3748/wjg.v21.i34.9927
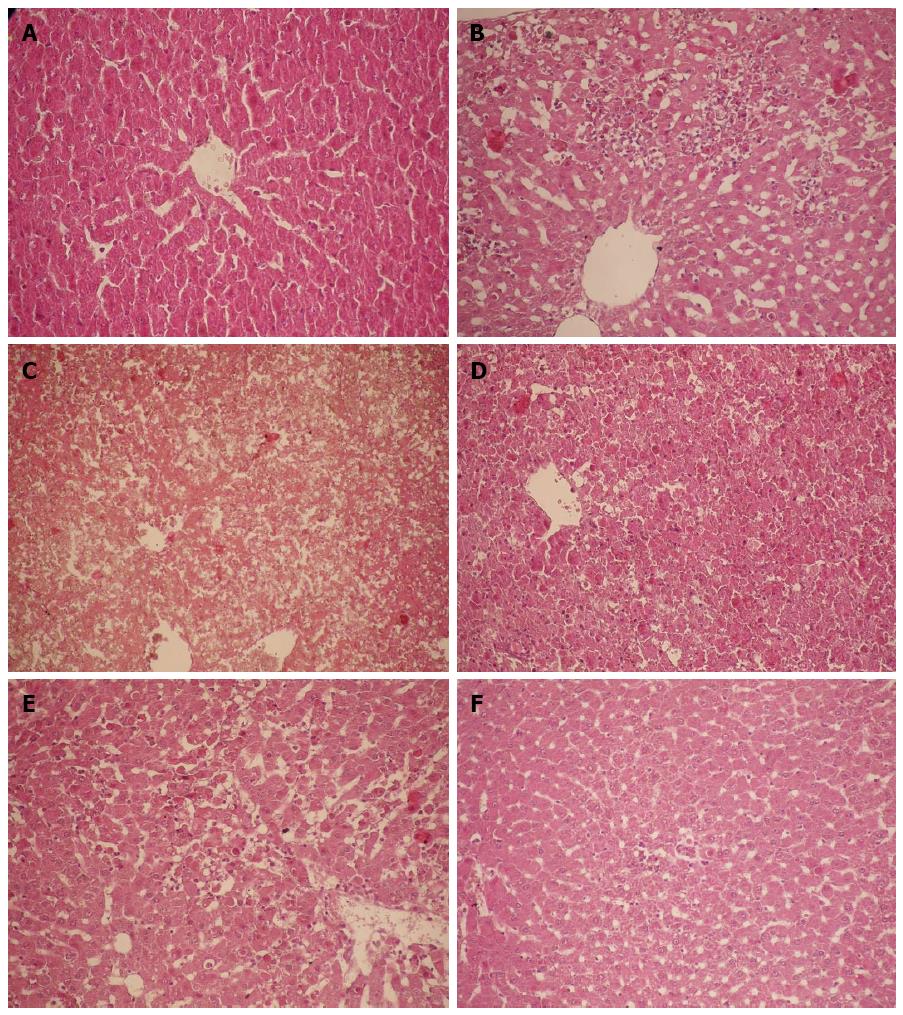
Figure 2 Histopathology of the liver (HE, × 200).
A: In the NS group, hepatocytes were arranged in chords; B: In the GalN/LPS group at 6 h, focal necrosis of hepatocytes was visible; C: In the GalN/LPS group at 12 h, massive hemorrhagic hepatic necrosis was visible; D: In the GalN/LPS group at 24 h, massive hemorrhagic hepatic necrosis was visible; E: In the GalN group at 12 h, focal necrosis of hepatocytes was visible; F: In the LPS group at 12 h, hepatocytes began to show necrosis, and incomplete necrosis was observed in some hepatocytes. D-GalN: D-galactosamine; LPS: Lipopolysaccharide; NS: Normalsaline.
- Citation: Wang JB, Wang HT, Li LP, Yan YC, Wang W, Liu JY, Zhao YT, Gao WS, Zhang MX. Development of a rat model of D-galactosamine/lipopolysaccharide induced hepatorenal syndrome. World J Gastroenterol 2015; 21(34): 9927-9935
- URL: https://www.wjgnet.com/1007-9327/full/v21/i34/9927.htm
- DOI: https://dx.doi.org/10.3748/wjg.v21.i34.9927


