Copyright
©The Author(s) 2015.
World J Gastroenterol. Sep 14, 2015; 21(34): 9900-9915
Published online Sep 14, 2015. doi: 10.3748/wjg.v21.i34.9900
Published online Sep 14, 2015. doi: 10.3748/wjg.v21.i34.9900
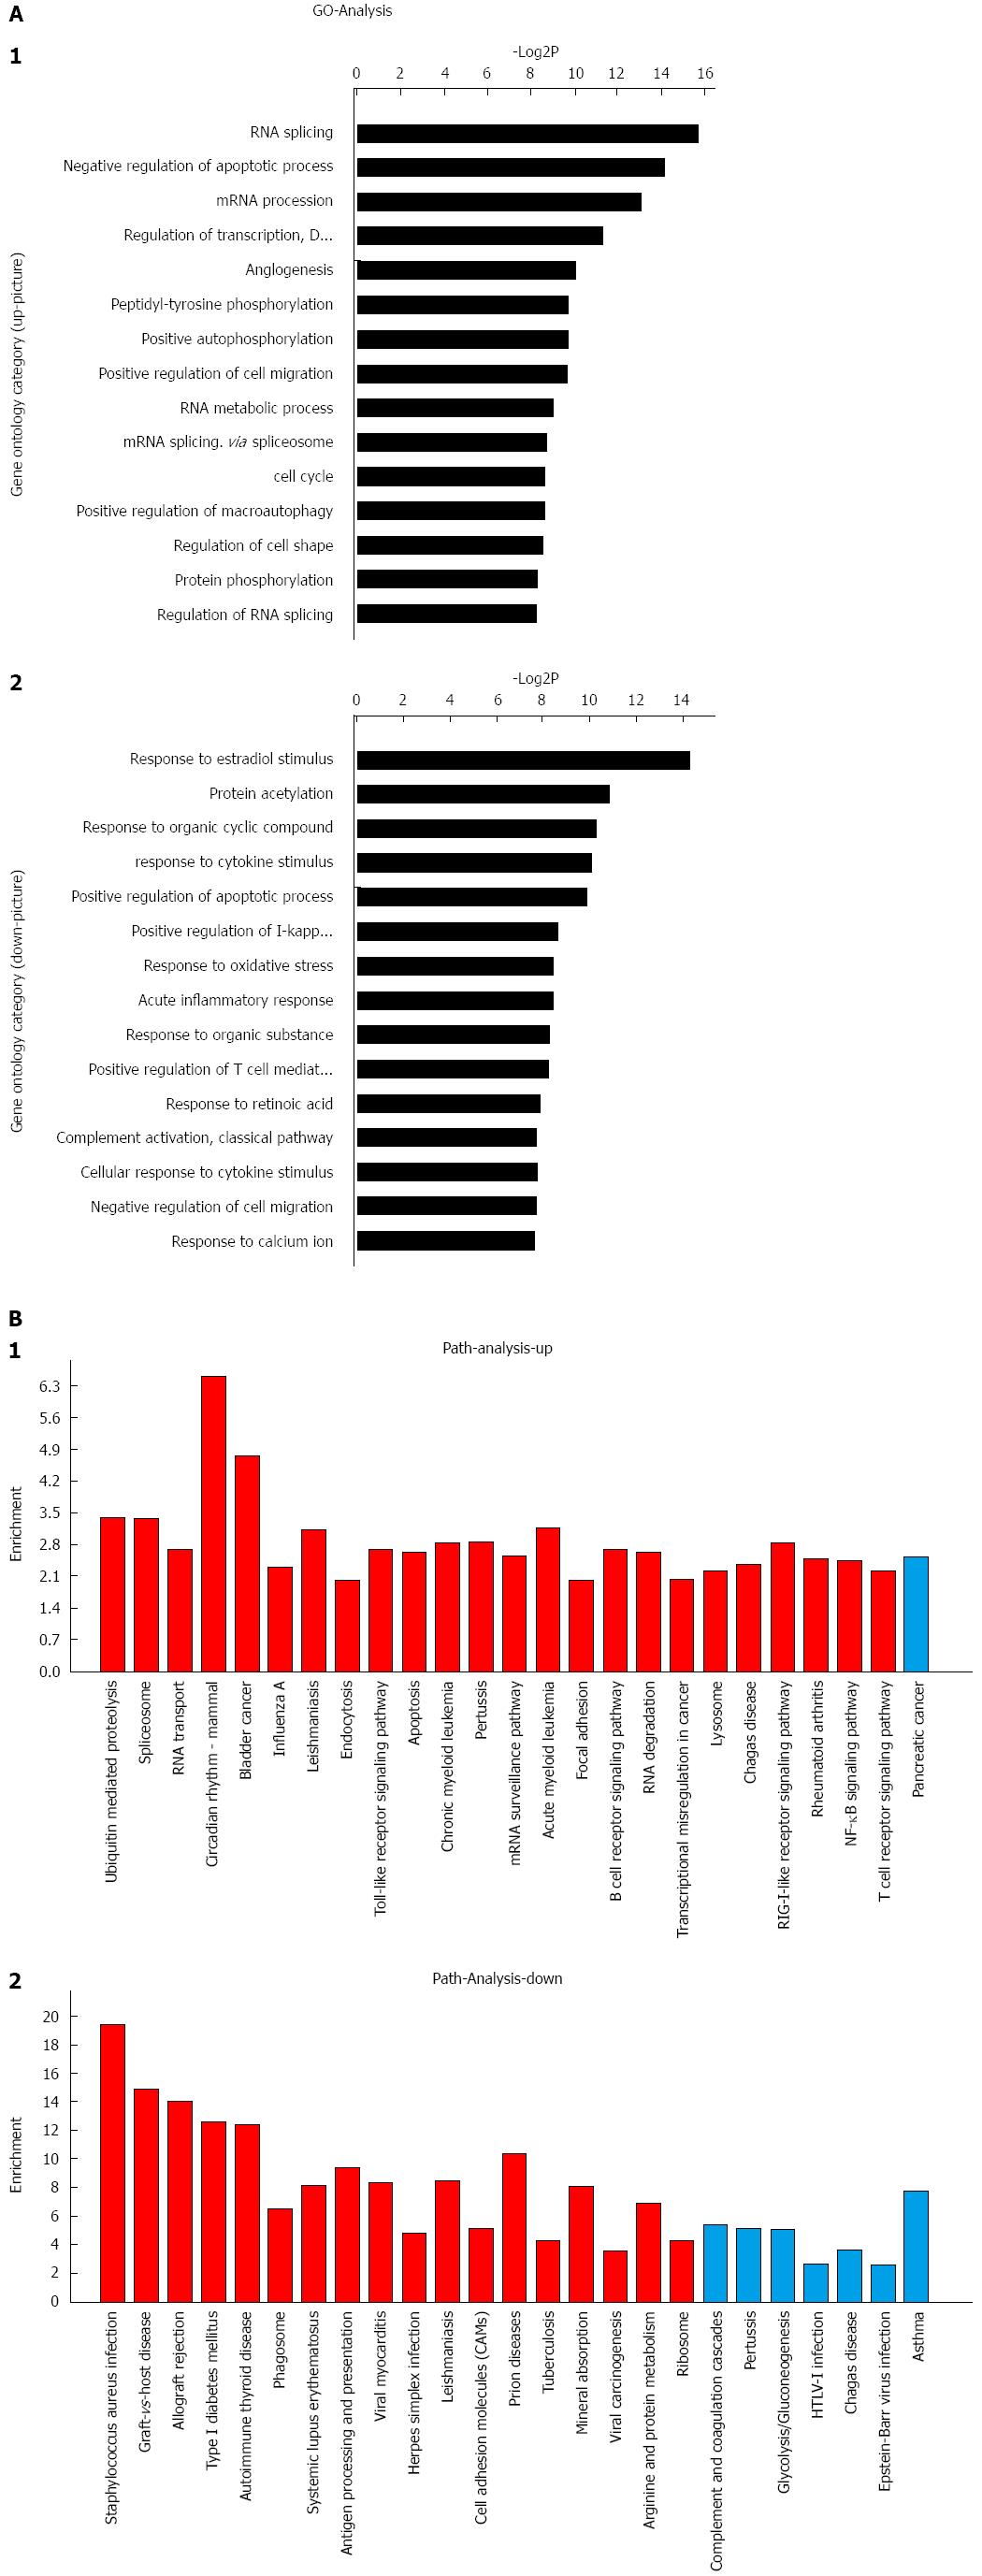
Figure 2 GO analysis and pathway analysis based on miRNA expression profiles.
A: Significant GOs targeted by upregulated miRNAs (1) and significant GOs targeted by downregulated miRNAs (2). The vertical axis is the GO category, and the horizontal axis is the enrichment of GOs; B: Significant pathways controlled by upregulated miRNAs (1) and significant pathways controlled by downregulated miRNAs (2). The horizontal axis is the pathway category, and the vertical axis is the enrichment of the pathway. GO: Gene ontology; NF-κB: Nuclear factor-kappa B.
- Citation: Qi F, Hu JF, Liu BH, Wu CQ, Yu HY, Yao DK, Zhu L. MiR-9a-5p regulates proliferation and migration of hepatic stellate cells under pressure through inhibition of Sirt1. World J Gastroenterol 2015; 21(34): 9900-9915
- URL: https://www.wjgnet.com/1007-9327/full/v21/i34/9900.htm
- DOI: https://dx.doi.org/10.3748/wjg.v21.i34.9900


