Copyright
©The Author(s) 2015.
World J Gastroenterol. Sep 14, 2015; 21(34): 9887-9899
Published online Sep 14, 2015. doi: 10.3748/wjg.v21.i34.9887
Published online Sep 14, 2015. doi: 10.3748/wjg.v21.i34.9887
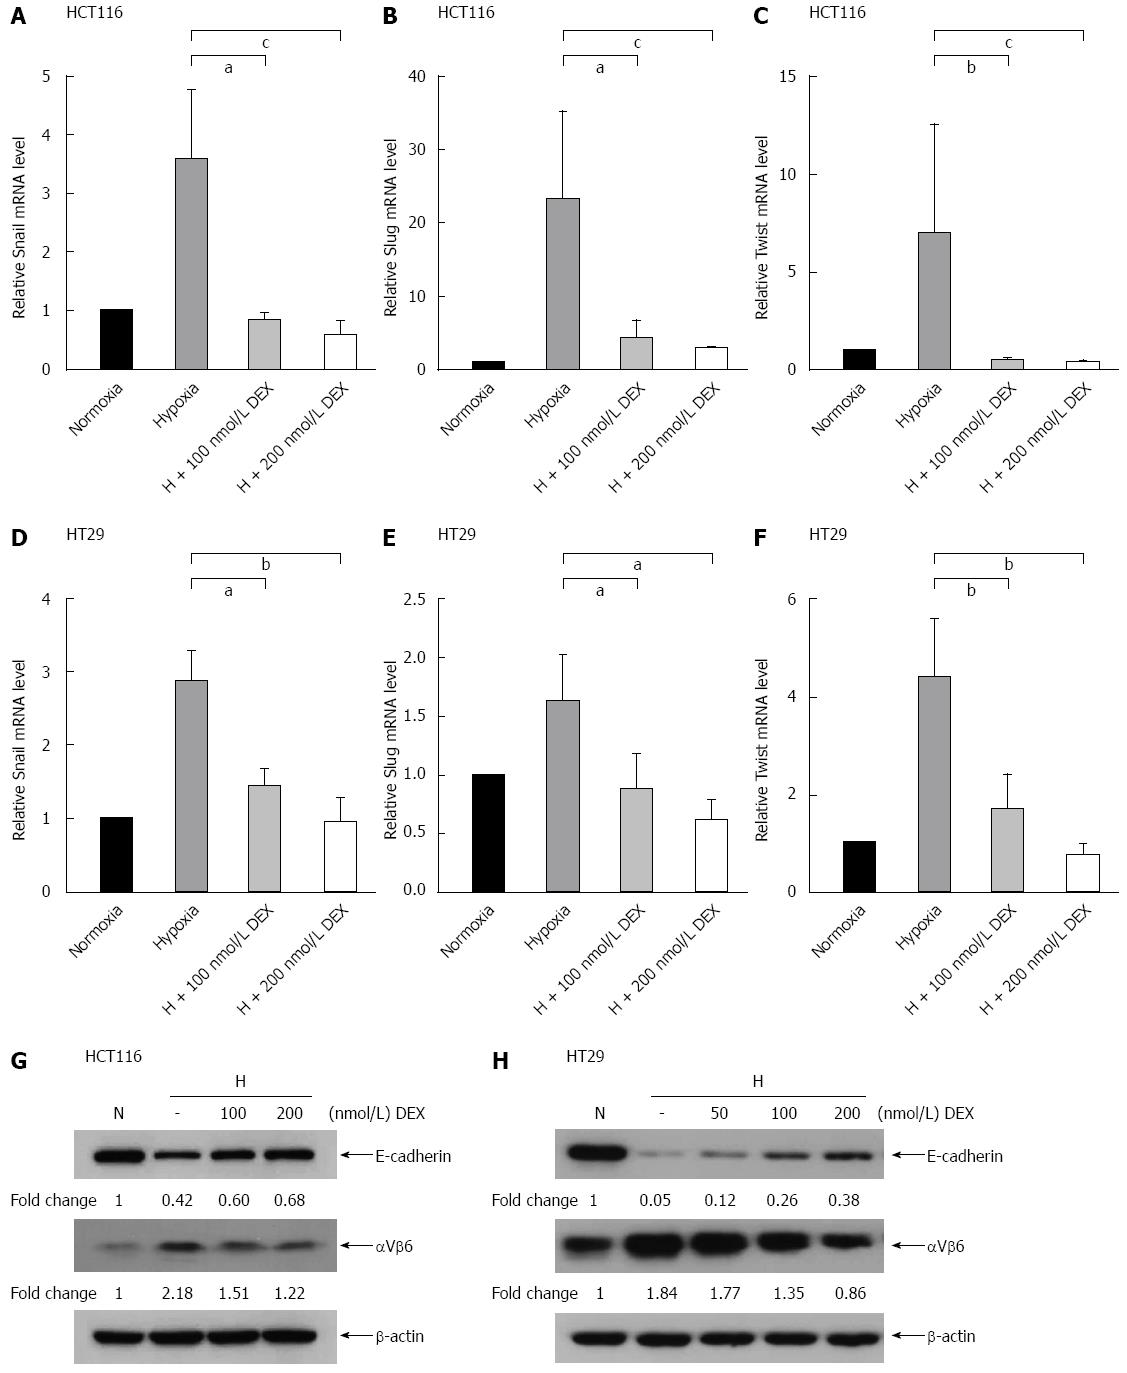
Figure 2 Effects of dexamethasone on the hypoxia-induced expression of epithelial-mesenchymal transition markers.
A-F: RNA was extracted from cells treated with DEX (100, 200 nmol/L) and/or hypoxia for 24 (A-C) or 72 h (D-F). Snail (A, D), Slug (B, E), and Twist (C, F) mRNA expression levels were then determined by qPCR and normalized to glyceraldehyde phosphate dehydrogenase. In hypoxic conditions, transcripts of Snail, Slug, and Twist were down-regulated in DEX-treated HCT116 and HT29 cells; G and H: E-cadherin, integrin αVβ6, and β-actin expression in cells treated with DEX (100, 200 nmol/L) and/or hypoxia for 5 (G) or 7 d (H) was assessed by Western blot analysis. Fold changes of E-cadherin and integrin αVβ6 bands were calculated after normalization to β-actin. E-cadherin was induced in HCT116 and HT29 cells treated with DEX in hypoxic conditions. Reversely, integrin αVβ6 was repressed by treated with DEX in HCT116 and HT29 cells under hypoxia. The error bar represents the standard deviation. aP < 0.05, bP < 0.01, and cP < 0.001 vs hypoxia-only groups. DEX: Dexamethasone; N: Normoxia; H: Hypoxia; qPCR: Real-time quantitative polymerase chain reaction.
- Citation: Kim JH, Hwang YJ, Han SH, Lee YE, Kim S, Kim YJ, Cho JH, Kwon KA, Kim JH, Kim SH. Dexamethasone inhibits hypoxia-induced epithelial-mesenchymal transition in colon cancer. World J Gastroenterol 2015; 21(34): 9887-9899
- URL: https://www.wjgnet.com/1007-9327/full/v21/i34/9887.htm
- DOI: https://dx.doi.org/10.3748/wjg.v21.i34.9887


