Copyright
©The Author(s) 2015.
World J Gastroenterol. Sep 14, 2015; 21(34): 10008-10017
Published online Sep 14, 2015. doi: 10.3748/wjg.v21.i34.10008
Published online Sep 14, 2015. doi: 10.3748/wjg.v21.i34.10008
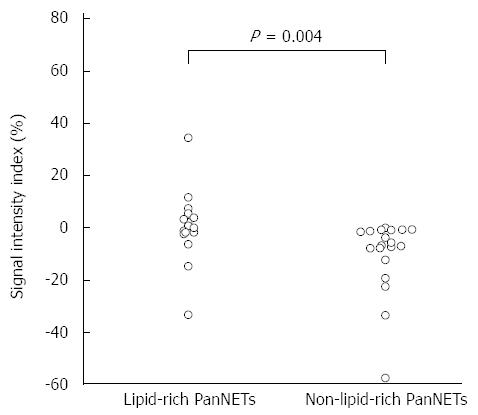
Figure 3 Scatterplot showing the differences in signal intensity index between lipid-rich and non-lipid-rich pancreatic neuroendocrine tumors.
Eight of 15 lipid-rich pancreatic neuroendocrine tumors (PanNETs) exhibit positive signal intensity index values, whereas 0 of 19 non-lipid-rich PanNETs show positive values. The signal intensity index is significantly higher in lipid-rich than in non-lipid-rich PanNETs (P = 0.004).
- Citation: Fukukura Y, Shindo T, Higashi M, Takumi K, Umanodan T, Yoneyama T, Yoshiura T. Computed tomography and magnetic resonance imaging features of lipid-rich neuroendocrine tumors of the pancreas. World J Gastroenterol 2015; 21(34): 10008-10017
- URL: https://www.wjgnet.com/1007-9327/full/v21/i34/10008.htm
- DOI: https://dx.doi.org/10.3748/wjg.v21.i34.10008


