Copyright
©The Author(s) 2015.
World J Gastroenterol. Sep 7, 2015; 21(33): 9741-9748
Published online Sep 7, 2015. doi: 10.3748/wjg.v21.i33.9741
Published online Sep 7, 2015. doi: 10.3748/wjg.v21.i33.9741
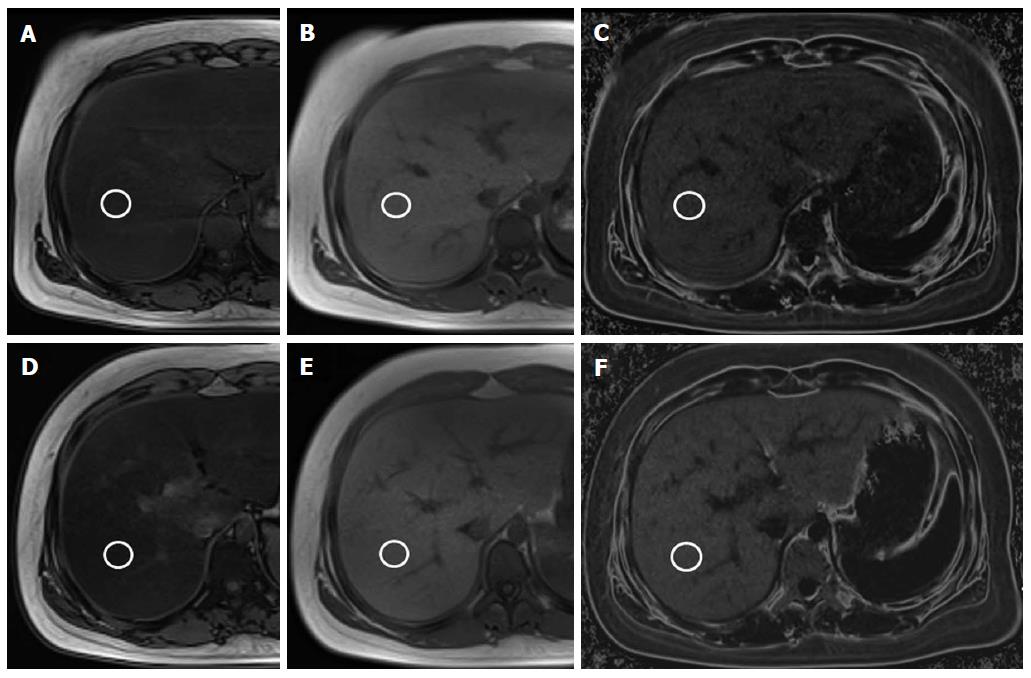
Figure 2 Liver fat quantification magnetic resonance in a 12-year-old girl in the non-compliant group.
The same circular regions of interest (white circles) are drawn to measure signal intensity in the liver parenchyma. On initial MR images (A-C), signal intensity of the liver is 299.1 on the opposed-phase image (A) and 644.6 on the in-phase image (B). Therefore, the calculated fat signal percentage in the liver on the dual-echo sequence is 26.8% [(644.6-299.1) × 100/2 × 644.6]. The fat signal percentage in the liver is 16.6% on the fat map image (C) of the triple-echo sequence. On follow-up liver MR after treatment (D-F), the fat signal is 238.6 on the opposed-phase image (D) and 750.6 on the in-phase image (E), with a calculated fat signal percentage of 34.1% [(750.6-238.6) × 100/2 × 750.6] on the dual-echo sequence. The triple-echo sequence image also demonstrates an increased hepatic fat signal percentage of 20.4% on the fat map image (F).
- Citation: Koh H, Kim S, Kim MJ, Kim HG, Shin HJ, Lee MJ. Hepatic fat quantification magnetic resonance for monitoring treatment response in pediatric nonalcoholic steatohepatitis. World J Gastroenterol 2015; 21(33): 9741-9748
- URL: https://www.wjgnet.com/1007-9327/full/v21/i33/9741.htm
- DOI: https://dx.doi.org/10.3748/wjg.v21.i33.9741


