Copyright
©The Author(s) 2015.
World J Gastroenterol. Aug 28, 2015; 21(32): 9544-9553
Published online Aug 28, 2015. doi: 10.3748/wjg.v21.i32.9544
Published online Aug 28, 2015. doi: 10.3748/wjg.v21.i32.9544
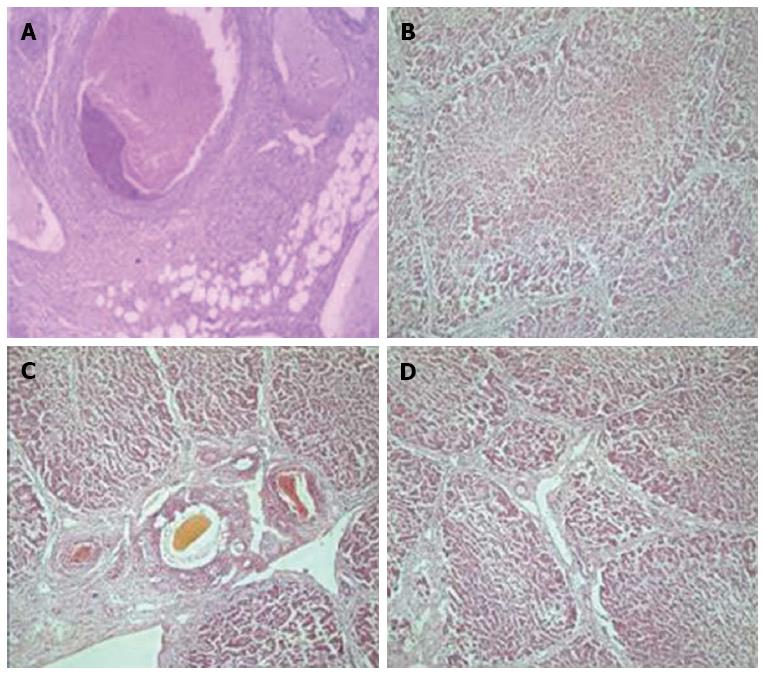
Figure 5 Pathological variation.
A: Within 6 h after perfusion in experimental group 2, thrombosis was evident in interlobular veins; B: At 2 wk after perfusion in experimental group 2, irregular, massive hepatocyte degeneration and necrosis were observed; C: At 4 wk after perfusion in experimental group 2, bile duct proliferation and dilation were evident; D: At 6 wk after perfusion in experimental group 2, pseudo-lobules formed with fibrous tissue proliferation and bridging fibrosis. Hematoxylin-eosin staining, magnification × 40 (A); × 200 (B-D).
- Citation: Wang L, He FL, Liu FQ, Yue ZD, Zhao HW. Establishment of a hepatic cirrhosis and portal hypertension model by hepatic arterial perfusion with 80% alcohol. World J Gastroenterol 2015; 21(32): 9544-9553
- URL: https://www.wjgnet.com/1007-9327/full/v21/i32/9544.htm
- DOI: https://dx.doi.org/10.3748/wjg.v21.i32.9544


