Copyright
©The Author(s) 2015.
World J Gastroenterol. Aug 14, 2015; 21(30): 9093-9102
Published online Aug 14, 2015. doi: 10.3748/wjg.v21.i30.9093
Published online Aug 14, 2015. doi: 10.3748/wjg.v21.i30.9093
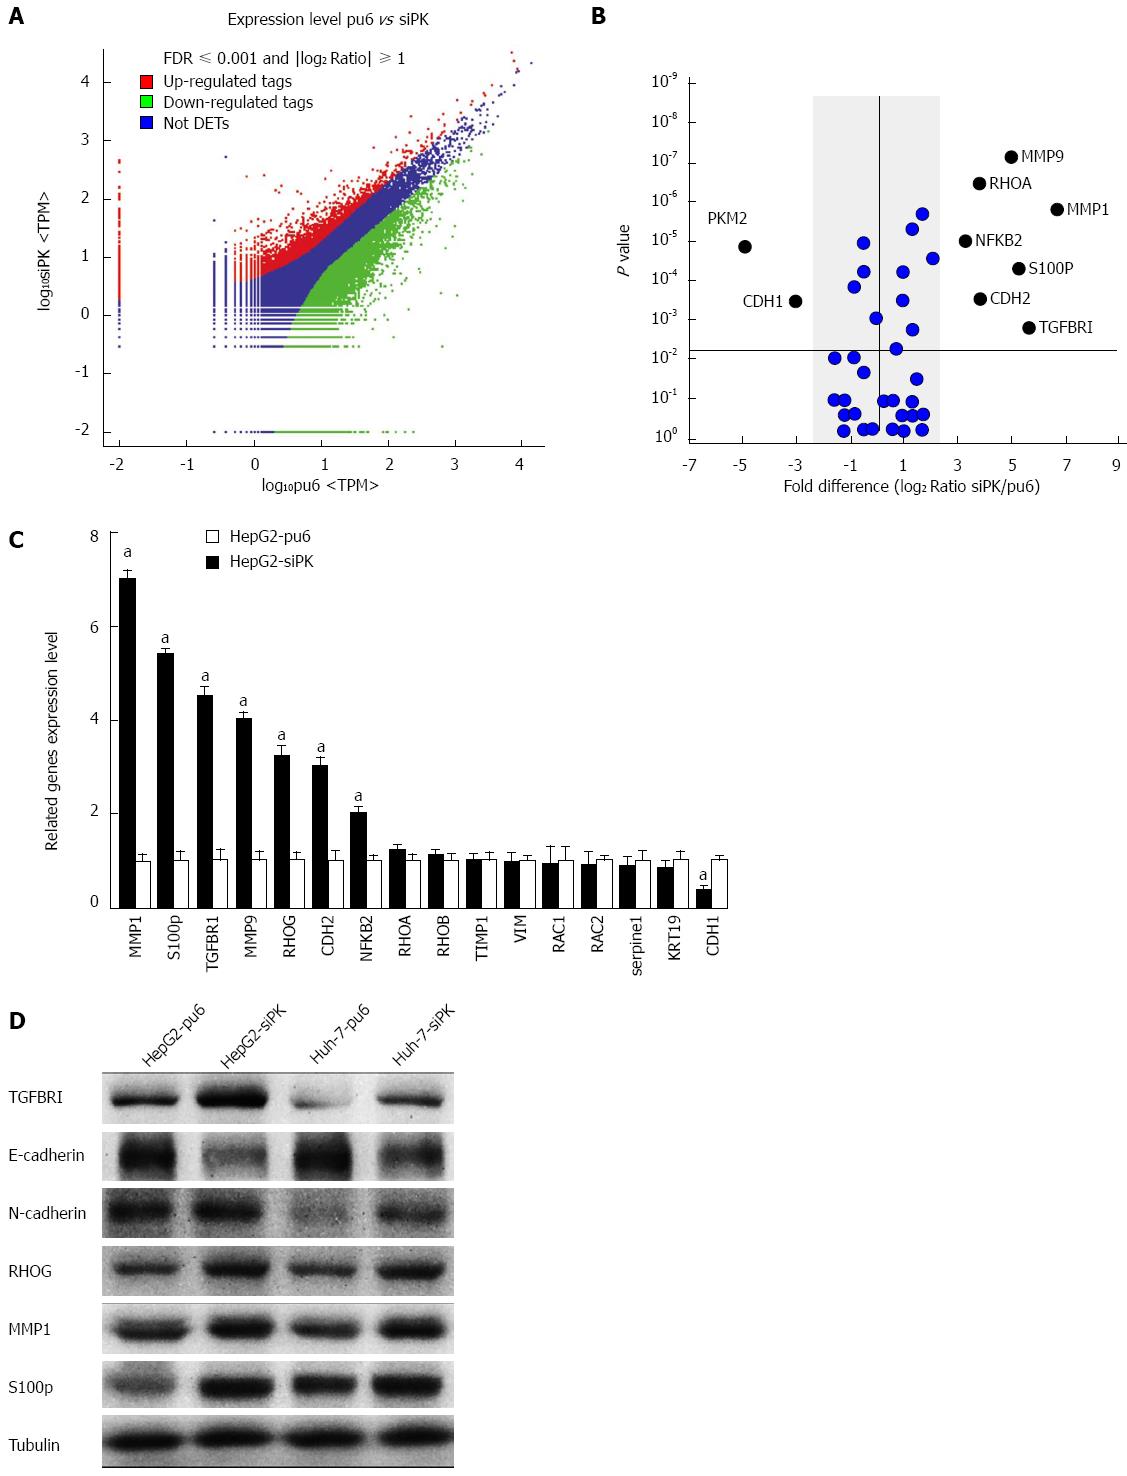
Figure 3 Differential gene expression between HepG2-pu6 and HepG2-siPK cells.
A: The number of statistically significant differentially expressed transcripts identified from the F-test. Color plots show the expression levels of significantly differentially expressed transcripts (P < 0.05 between groups and false discovery rate 0.05) between HepG2-pu6 and HepG2-siPK cells. The upregulated genes are indicated in red, and the downregulated genes are indicated in green. Genes that did not show a statistically significant difference are indicated in blue; B: The graph shows gene expression in relation to cell migration and invasion. Fold differences were calculated based on the log2 ratio of siPK/pu6; C: A comparison of the RT-qPCR and RNA sequence expression analysis; D: The expression levels of genes that were determined to have statistically significant differences in expression were analyzed by immunoblot analysis in stable HepG2 and Huh-7 cells.
- Citation: Chen YL, Song JJ, Chen XC, Xu W, Zhi Q, Liu YP, Xu HZ, Pan JS, Ren JL, Guleng B. Mechanisms of pyruvate kinase M2 isoform inhibits cell motility in hepatocellular carcinoma cells. World J Gastroenterol 2015; 21(30): 9093-9102
- URL: https://www.wjgnet.com/1007-9327/full/v21/i30/9093.htm
- DOI: https://dx.doi.org/10.3748/wjg.v21.i30.9093


