Copyright
©The Author(s) 2015.
World J Gastroenterol. Aug 14, 2015; 21(30): 9067-9078
Published online Aug 14, 2015. doi: 10.3748/wjg.v21.i30.9067
Published online Aug 14, 2015. doi: 10.3748/wjg.v21.i30.9067
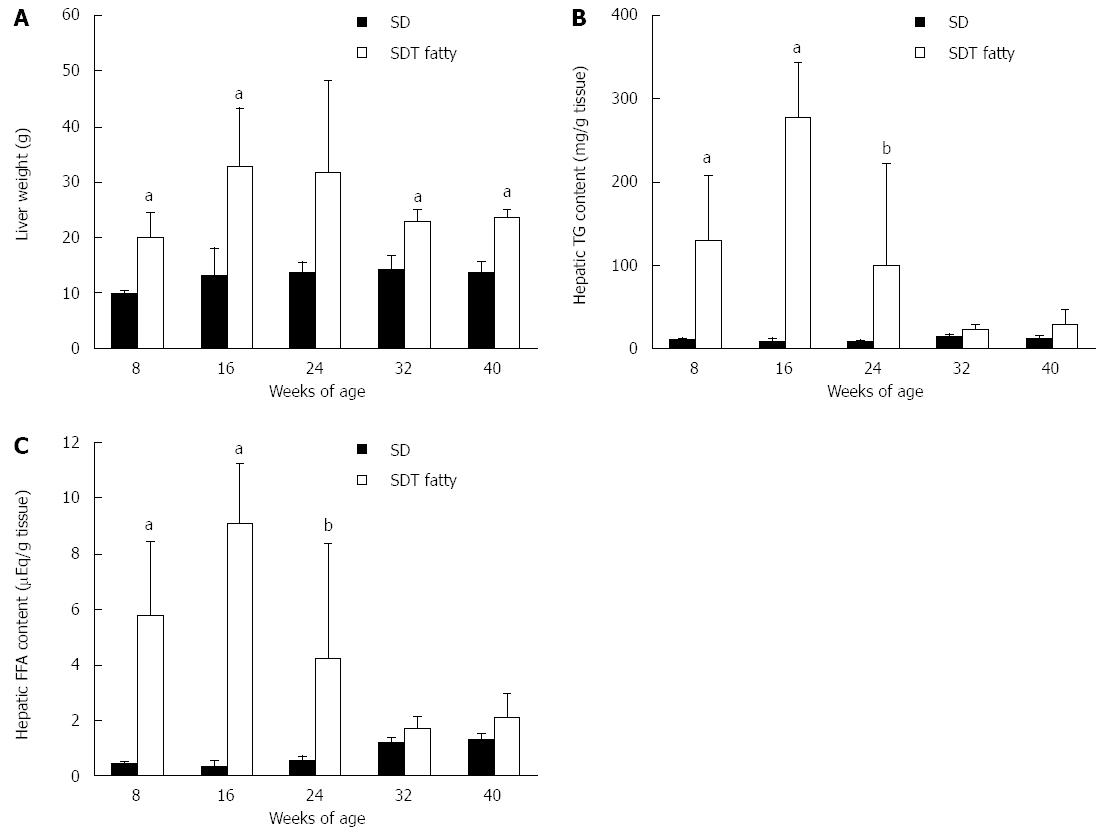
Figure 2 Changes in liver weight, hepatic triglyceride, and fatty acid contents in Spontaneously Diabetic Torii fatty rats and Sprague-Dawley rats.
A: Liver weight; B: Hepatic triglyceride content; C: Hepatic fatty acid content. Data are shown as the mean ± SD (n = 4-5). Data are shown as the mean ± SD (n = 4-5). aP < 0.05, bP < 0.01, vs SD rats. FFA: Free fatty acid; TG: Triglyceride.
- Citation: Ishii Y, Motohashi Y, Muramatsu M, Katsuda Y, Miyajima K, Sasase T, Yamada T, Matsui T, Kume S, Ohta T. Female spontaneously diabetic Torii fatty rats develop nonalcoholic steatohepatitis-like hepatic lesions. World J Gastroenterol 2015; 21(30): 9067-9078
- URL: https://www.wjgnet.com/1007-9327/full/v21/i30/9067.htm
- DOI: https://dx.doi.org/10.3748/wjg.v21.i30.9067


