Copyright
©The Author(s) 2015.
World J Gastroenterol. Aug 7, 2015; 21(29): 8817-8825
Published online Aug 7, 2015. doi: 10.3748/wjg.v21.i29.8817
Published online Aug 7, 2015. doi: 10.3748/wjg.v21.i29.8817
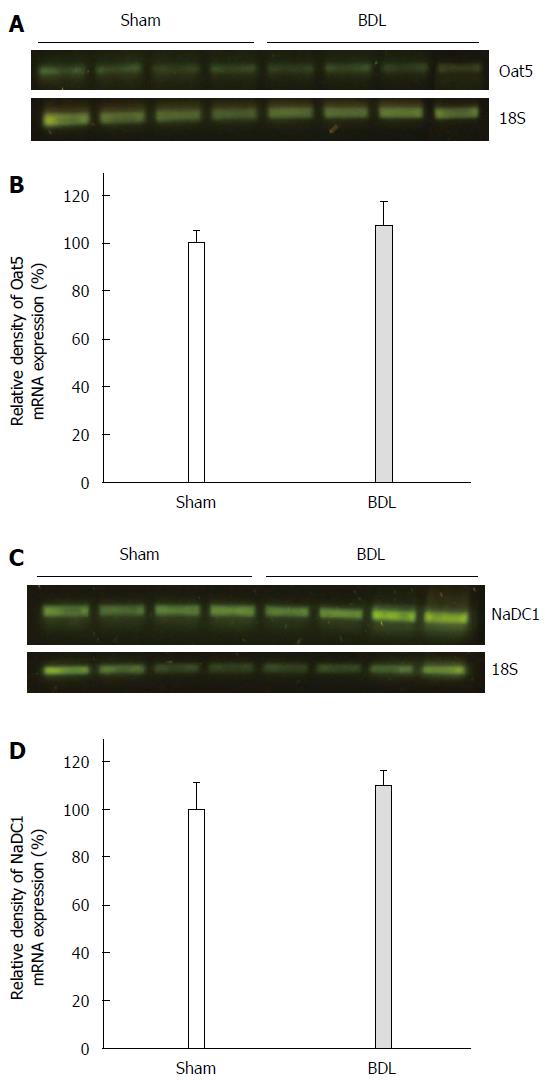
Figure 5 Expression of Oat5 (A, B) and NaDC1 (C, D) mRNA in the kidney from Sham and BDL rats.
Data are presented as percentage considering the mean Sham value as 100%. Results are expressed as mean ± SE of four rats per group. The 18S mRNA was used as internal control.
- Citation: Brandoni A, Torres AM. Expression of renal Oat5 and NaDC1 transporters in rats with acute biliary obstruction. World J Gastroenterol 2015; 21(29): 8817-8825
- URL: https://www.wjgnet.com/1007-9327/full/v21/i29/8817.htm
- DOI: https://dx.doi.org/10.3748/wjg.v21.i29.8817


