Published online Aug 7, 2015. doi: 10.3748/wjg.v21.i29.8878
Peer-review started: January 27, 2015
First decision: March 10, 2015
Revised: March 25, 2015
Accepted: May 7, 2015
Article in press: May 7, 2015
Published online: August 7, 2015
AIM: To characterize the computed tomography (CT) findings in patients with post-inflammatory esophageal strictures (corrosive and peptic) and reveal the optimal scanning phase protocols for distinguishing post-inflammatory esophageal stricture and esophageal cancer.
METHODS: Sixty-five patients with esophageal strictures of different etiology were included in this study: 24 patients with 27 histopathologically confirmed corrosive strictures, 10 patients with 12 peptic strictures and 31 patients with esophageal cancer were evaluated with a two-phase dynamic contrast-enhanced MDCT. Arterial and venous phases at 10 and 35 s after the attenuation of 200 HU were obtained at the descending aorta, with a delayed phase at 6-8 min after the start of injection of contrast media. For qualitative analysis, CT scans of benign strictures were reviewed for the presence/absence of the following features: “target sign”, luminal mass, homogeneity of contrast medium uptake, concentric wall thickening, conically shaped suprastenotic dilatation, smooth boundaries of stenosis and smooth mucous membrane at the transition to stenosis, which were compared with a control group of 31 patients who had esophageal cancer. The quantitative analysis included densitometric parameter acquisition using regions-of-interest measurement of the zone of stenosis and normal esophageal wall and the difference between those measurements (ΔCT) at all phases of bolus contrast enhancement. Esophageal wall thickening, length of esophageal wall thickening and size of the regional lymph nodes were also evaluated.
RESULTS: The presence of a concentric esophageal wall, conically shaped suprastenotic dilatation, smooth upper and lower boundaries, “target sign” and smooth mucous membrane at the transition to stenosis were suggestive of a benign cause, with sensitivities of 92.31%, 87.17%, 94.87%, 76.92% and 82.05%, respectively, and specificities of 70.96%, 89.66%, 80.65%, 96.77% and 93.55%, respectively. The features that were most suggestive of a malignant cause were eccentric esophageal wall thickening, tuberous upper and lower boundaries of stenosis, absence of mucous membrane visualization, rupture of the mucous membrane at the upper boundary of stenosis, cup-shaped suprastenotic dilatation, luminal mass and enlarged regional lymph nodes with specificities of 92.31% 94.87%, 67.86%, 100%, 97.44%, 94.87% and 82.86%, respectively and sensitivities of 70.97%, 80.65%, 96.77%, 80.65%, 54.84%, 87.10% and 60%, respectively. The highest tumor attenuation occurred in the arterial phase (mean attenuation 74.13 ± 17.42 HU), and the mean attenuation difference between the tumor and the normal esophageal wall (mean ΔCT) in the arterial phase was 23.86 ± 19.31 HU. Here, 11.5 HU of ΔCT in the arterial phase was the cut-off value used to differentiate esophageal cancer from post-inflammatory stricture (P = 0.000). The highest attenuation of post-inflammatory strictures occurred in the delayed phase (mean attenuation 71.66 ± 14.28 HU), and the mean ΔCT in delayed phase was 34.03 ± 15.94 HU. Here, 18.5 HU of ΔCT in delayed phase was the cut-off value used to differentiate post-inflammatory stricture from esophageal cancer (P < 0.0001).
CONCLUSION: The described imaging findings reveal high diagnostic significance in the differentiation of benign strictures from esophageal cancer.
Core tip: Two-phase dynamic multidetector computed tomography was proposed to evaluate esophageal stenosis. No previous studies have evaluated the utility of this method for post-inflammatory strictures. We investigated this method’s ability to evaluate benign strictures by qualitatively and quantitatively assessing changes in the esophageal walls and demonstrated that the majority of patients with benign strictures had concentric wall thickening with smooth boundaries, conically shaped suprastenotic dilatation, a “target sign”, smooth mucous membrane at the transition to stenosis. An assessment of the dynamics of contrast material accumulation by strictures revealed that the arterial and delayed phases are optimal for differentiating benign strictures from esophageal cancer.
- Citation: Karmazanovsky GG, Buryakina SA, Kondratiev EV, Yang Q, Ruchkin DV, Kalinin DV. Value of two-phase dynamic multidetector computed tomography in differential diagnosis of post-inflammatory strictures from esophageal cancer. World J Gastroenterol 2015; 21(29): 8878-8887
- URL: https://www.wjgnet.com/1007-9327/full/v21/i29/8878.htm
- DOI: https://dx.doi.org/10.3748/wjg.v21.i29.8878
Although computed tomography (CT) has not been used as the primary modality for evaluating esophageal lesions, both benign and malignant stenoses may be manifested on CT by focal or extended thickening of the esophageal wall[1,2]. Other causes of a thickened esophageal wall on CT include Barrett’s esophagus, esophagitis, secondary achalasia, diffuse esophageal spasm, varices, and esophageal intramural pseudodiverticulosis[3]. Some characteristic CT-findings of peptic stenosis and corrosive esophageal strictures have been briefly described in the literature[4-6]. To our knowledge, no detailed description of CT findings in post-inflammatory benign esophageal strictures has been published in the radiology literature. No study has analysed the value of CT with bolus contrast enhancement in the differential diagnosis of esophageal stenosis with a benign etiology. The purpose of our study was to assess the significantly more common CT findings in patients with post-inflammatory benign esophageal strictures (corrosive and peptic) and thereby reveal the optimal scanning phases of the protocol for distinguishing post-inflammatory esophageal stricture and esophageal cancer.
After examining the PACS database for the period from October 2010 to December 2014, 65 patients, who underwent thoracic CT and had a definitive diagnosis, were included in this retrospective study. A review of the patients’ medical records and CT reports identified 31 patients (25 men, 6 women; mean age 65 years; range, 41-81 years) with a diagnosis of esophageal cancer, 24 patients (11 men, 12 women; mean age 48 years; range, 23-74 years) with 27 corrosive esophageal strictures, and 10 patients (6 men, 4 women; mean age, 49 years; range, 19-66 years) with 12 peptic strictures. The cause of stenosis included ingestion of caustic agents in 23 patients, and gastroesophageal reflux disease in 10 patients. In the 31 other patients a clinical diagnosis of esophageal cancer was made by esophagography or endoscopy and clinical data. Patients with stents, after radiotherapy and chemotherapy were not included in the study because pronounced fibrous tissue around the stent and necrotic areas in the tumor may affect the MDCT image of a typical stenosis tissue.
The definitive pathologic diagnosis was based on the results of biopsy in 5 cases of T4 stage esophageal cancer, the results of endoscopy in 3 cases with short corrosive esophageal strictures and in 5 cases of peptic strictures. The patients with T4 stages esophageal cancer underwent palliative treatment, and patients with those with strictures had sessions of bougienage. Another 57 patients underwent surgery, which comprised: either transthoracic and/or transhiatal esophagectomy with posterior mediastinal gastric tube or replacement of the left part of the colon. All pathologic specimens were histologically investigated after surgery by a pathologist. The histologic assessment of benign vs malignant stenosis was determined based on the standard architectural and cytologic features[7,8].
CT scans were obtained as part of the initial assessment of these patients at our institution. Multidetector CT (MDCT) was performed using 64 and 256 MDCTs (Philips Brilliance CT-64, Brilliance iCT-256 (Philips Medical Systems (Cleveland, Ohio 44143 United States). Examination was performed in the supine position with patient’s hands behind his/her head. Scanning was performed with a gulp of potable water in unenhanced, arterial and delayed phases with the patient holding their breath. Cranio-caudal scanning from neck to upper abdomen was performed. The following scanning parameters were used: collimation 0.9 mm, reconstruction interval 0.45 mm, pitch 1, tube rotation rate 0.75 s. Nonionic contrast agents (Optiray 350, Omnipaque 350, Ultravist 370, Visipaque 320) were injected intravenously using a dual head automatic injector OptiVantage DH (Mallinckrodt; InC) with a rate of 4-5 mL/s. A bolus of contrast agent was followed by bolus “chaser” (normal saline, 40-50 mL, with the same rate).
To start scanning, the “bolus tracking” software package was used. Two contrast enhanced phases were performed at 10 and 34 s for arterial and venous phases after the attenuation of the descending aorta reached 200 HU. The delayed phase was performed 4-6 min after the injection of contrast agent.
All data were reconstructed with a 1 mm section thickness at 1-mm intervals. Post-processing was performed using the Brilliance Portal [Philips Medical Systems (ClevelanD)]. Images were assessed in all examination phases.
The thoracic CT of 64 patients was reviewed retrospectively by two experienced radiologists, who had 4 and 6 years of experience in gastrointestinal radiology. All images were de-identified. Radiologists were blinded to the histological results, numbers and locations of the stenoses described in the surgical, radiologic and endoscopic findings. The final interpretations were made by consensus.
All CT data were assessed for the following findings: (1) thickness of the esophageal wall (concentric or eccentric); (2) upper and lower boundaries at the coronal view of the multiplanar reconstruction image (smooth or tuberous); (3) a luminal mass (presence or absence); (4) a “target sign” (presence or absence); (5) contrast medium uptake by thickened esophageal walls (heterogeneity or homogeneity); (6) suprastenotic dilatation (cup-shaped or conically shaped); (7) mucous membrane at the transition to stenosis (smooth or rupture); and (8) thickness, length and size of the regional lymph nodes (mm).
The esophageal wall was considered thickened when its thickness was greater than 5 mm[1,9]. The actual wall thickness and length of thickened walls in these patients were measured (mm). Wall thickening was considered eccentric when there was asymmetry in the thickening of the two walls of the esophagus. When the lumen was not obliterated or partially collapsed, the thickness of a single esophageal wall was measured from its outer to inner borders. In the patients in whom the lumen could not be identified (obliterated or collapsed), thickness was calculated as one half of the thickness, measured from the outer border of one wall to the outer border of the opposing wall in the short axis of the cross section of the esophagus.
The upper and lower boundaries of thickened walls were analysed at the coronal view of the multiplanar reconstruction image and were considered to be tuberous if they were irregular.
A luminal mass was considered to be present when there was a soft-tissue mass in the lumen that arose from the esophageal wall.
A “target sign” was considered to be present when there was a combination of an enhanced saved mucosa and a hypodense submucosa in the thickened esophageal walls[1,10].
Heterogeneity of contrast medium uptake was considered to be present when hypo- and/or hyperdense components were visualized in pathologically changed esophageal walls.
If a suprastenotic dilatation was present, the radiologist noted whether it was conically shaped or cup-shaped.
The shape of a mucous membrane at the transition to stenosis at the coronal view of the multiplanar reconstruction image was analysed, concerning whether it was smooth or whether its rupture occurred at the upper boundary of stenosis.
In all cases a short-axis diameter of the largest regional (cervical, tracheobronchial, mediastinal, gastric or celiac) lymph node was analyzed. It was considered enlarged if its short-axis diameter was greater than 10 mm in the transverse plane.
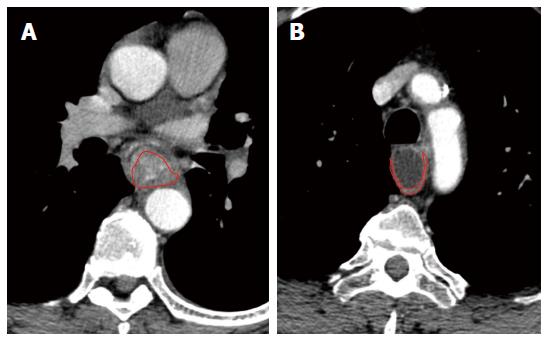
Esophageal wall attenuation in hounsfield units (HU) was measured at all phases of bolus contrast enhancement. A reliable region of interest (ROI) within the thickened esophageal wall was manually drawn in the transverse section, and the area of ROI was more than 60% of that of the entire thickened esophageal wall in the same section (Figure 1). The tumor attenuation value was derived automatically by the workstation software. To minimize partial volume averaging with the surrounding tissues, the intraluminal gas and periesophageal fat were carefully excluded when drawing the ROI of stenosis. The attenuation of the normal esophagus in groups was measured by drawing the ROI of the intact esophageal walls. Subsequently, ΔCT was calculated by subtracting the referenced attenuation value of the background normal esophageal wall from the representative attenuation value for esophageal stenosis.
Patients were divided into two groups based on the pathologic findings. Patients with histopathologically confirmed corrosive (n = 27) and peptic (n = 12) strictures were included in group A (“benign stenosis”) and patients with esophageal cancer (n = 31) were included in group B (“malignant stenosis”).
Correlations between the features and groups A and B were examined. We used the Pearson product moment correlation coefficient (r) to assess the strengths of the associations that involve normal data distributions of quantitative features and the Spearman’s rank correlation test (rs) to assess the strengths of the associations that involve non-normal data distributions of quantitative CT features and qualitative CT features. A of P value less than 0.05 was considered statistically significant. The general classification of correlations according to their strength was as follows: (1) strong, or close when the correlation coefficient was more than 0.70; (2) average from 0.50 to 0.69; (3) moderate from 0.30 to 0.49; (4) weak from 0.20 to 0.29; and (5) weakest less than 0.19. CT features with strong and average values of the correlation coefficient were suggested to be the most useful for differentiating post-inflammatory benign esophageal strictures and esophageal cancer. Sensitivity and specificity were also calculated for all features.
With statistical software (version 17.0 for Windows, SPSS), independent sample Student’s t tests were performed to compare ΔCT between the groups with esophageal cancer and the groups with post-inflammatory strictures. A P value less than 0.05 indicated a significant difference. After a significant difference was shown, receiver operating characteristic (ROC) analysis was carried out to determine the cut-off of ΔCT for discriminating stenosis (esophageal cancer and post-inflammatory benign esophageal strictures) from background normal esophagus. Measurements obtained at the gastroesophageal junction were excluded from the determination of the overall mean wall thickness because of a known problem with apparent thickening of the wall or pseudomass lesions at this level[8,10]. The statistical methods of this study were reviewed by Margarita V. Khakhanova of the Vishnevsky Institute of Surgery.
The imaging findings obtained from groups A (“benign stenosis”) which included 27 corrosive and 12 peptic strictures and B (“malignant stenosis”), which included 31 esophageal cancers, are summarized in Table 1. In the pathologic reports, esophageal squamous cell cancer was found in 23 cases and esophageal adenocarcinoma was found in 8 cases. Seventeen (54.8%) patients with esophageal cancer had T3 stage, 5 (16.2%) patients had T4 stage, 6 (19.4%) patients had T2 stage, and 3 (9.6%) patients had T1 stage, according to the classification of the Union for International Cancer Control.
| CT features | Group A(benign stenosis,n = 39) | Group B(malignant stenosis,n = 31) |
| Luminal mass | 2 | 27 |
| Heterogeneity of contrast medium uptake | 3 | 10 |
| Homogeneity of contrast medium uptake | 36 | 21 |
| Eccentric esophageal wall thickening | 3 | 22 |
| Concentric esophageal wall thickening | 37 | 9 |
| Suprastenotic dilatation cup-shaped | 1 | 17 |
| Suprastenotic dilatation conically shaped | 34 | 5 |
| Smooth mucous membrane at the transition to stenosis | 32 | 2 |
| Rupture of the mucous membrane at the upper boundary of stenosis | 0 | 25 |
| Smooth upper and lower boundaries | 37 | 6 |
| Tuberous upper and lower boundaries | 2 | 25 |
| Presence of the mucous membrane in the stenosis «target sign» | 30 | 1 |
| Absence of the mucous membrane visualization in thickened walls | 9 | 30 |
| Presence of enlarged lymph nodes | 6 | 18 |
The correlation analysis results examining the CT features in group A are summarized in Table 2.
| CT-features | Spearman’s rank correlation test (rs), Pearson product moment correlation coefficient (r) | P value |
| Concentric esophageal wall thickening | rs = 0.656 | 0.000 |
| Smooth upper and lower boundaries | rs = 0.510 | 0.000 |
| Absence of the luminal mass | rs = 0.827 | 0.000 |
| Presence of the mucous membrane in the stenosis ("target sign") | rs = 0.779 | 0.000 |
| Homogeneity of contrast medium uptake | rs = 0.354 | 0.003 |
| Conically shaped suprastenotic dilatation | rs = 0.711 | 0.000 |
| Smooth mucous membrane at the transition to stenosis | rs = 0.657 | 0.000 |
| Size of the regional lymph nodes | rs =0.542 | 0.000 |
| Wall thickness (mm) | rs = 0.080 | 0.437 |
| Length of esophageal wall thickness (mm) | rs = 0.263 | 0.290 |
| CT attenuation value of the post-inflammatory stricture in native phase | r = 0.055 | 0.652 |
| CT attenuation value of the post-inflammatory stricture in arterial phase | r = -0.736 | 0.000 |
| CT attenuation value of the post-inflammatory stricture in venous phase | r = -0.444 | 0.000 |
| CT attenuation value of the post-inflammatory stricture in delayed phase | r = 0.579 | 0.000 |
| ΔCT in unenhanced phase | r = 0.068 | 0.594 |
| ΔCT in arterial phase | r = -0.709 | 0.000 |
| ΔCT in venous phase | r = -0.565 | 0.000 |
| ΔCT in delayed phase | r = 0.652 | 0.000 |
In group A, esophageal thickening (more than 5 mm) was observed in 32 (82%) patients; in group B, esophageal thickening was observed in 30 (96.8%) patients. The overall mean esophageal wall thickness was 17.6 mm with a range of 6-38 mm (SD = 7.3 mm; 95%CI: 14.9-20.3 mm) in the 31 patients with malignant stenosis vs 8.68 mm with a range of 4-21 mm (SD = 3.4 mm; 95%CI: 7.56-9.81 mm) in the 39 patients with benign stenosis. However, the correlation between wall thickness and the type of stenosis was insignificant (rs = 0.080, P = 0.437). The overall mean length of esophageal wall thickness was 71.33 mm with a range of 11-135 mm (SD = 33.67 mm; 95%CI: 58.76-83.91 mm) in the patients with malignant stenosis vs 56.57 mm, with a range of 3-350 mm (SD = 61.22 mm; 95%CI: 36.16-76.98 mm), in patients with benign stenosis. However, the correlation between the length and type of stenosis was also insignificant (rs = 0.263, P = 0.29). In group A the mean size of the regional lymph nodes was 6.82 ± 2.9 (range, 3-15) and in group B it was 10.77 ± 3.6 (range, 5-18). An average correlation between enlarged regional lymph nodes and etiology of the stenosis was found (r = 0.542, P < 0.000).
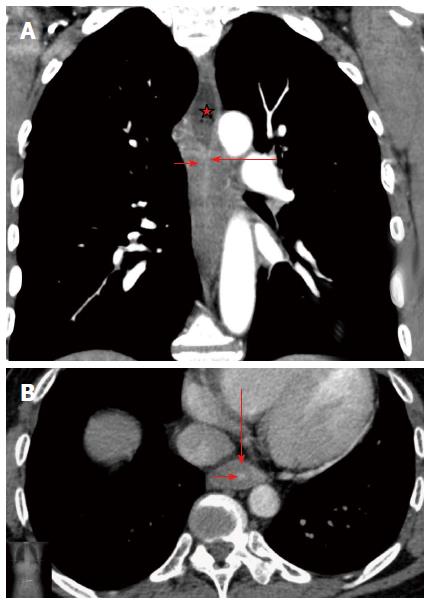
The presence of the following factors was suggestive of a benign cause: concentric esophageal wall thickening with a sensitivity of 92.31% and a specificity of 70.96%; conically shaped suprastenotic dilatation, with a sensitivity of 87.17% and a specificity of 89.66%; smooth upper and lower boundaries, with a sensitivity of 94.87% and a specificity of 80.65%; presence of the mucous membrane in the stenosis, with a sensitivity of 76.92% and a specificity of 96.77%; and smooth mucous membrane at the transition to stenosis, with a sensitivity of 82.05% and a specificity of 93.55% (Figure 2). The correlation between the homogeneity of contrast medium uptake and the type of stenosis was moderate (rs = 0.354, P = 0.003). This feature had a high sensitivity (92.31%) but low specificity (32.26%).
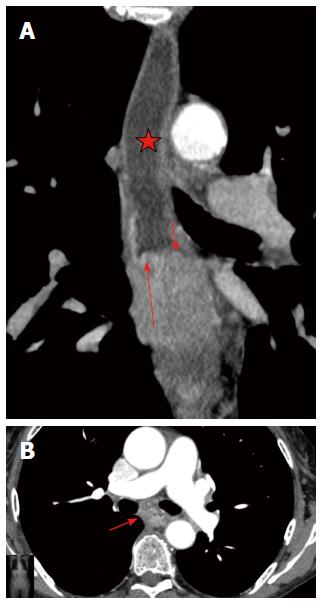
We identified the following imaging findings of malignant stenosis: eccentric esophageal wall thickening with a specificity of 92.31% and a sensitivity of 70.97%; tuberous upper and lower boundaries of stenosis with a specificity of 94.87% and a sensitivity of 80.65%; absence of the mucous membrane visualization in stenosis, which were observed in the majority of patients (96.8%) with a specificity of 67.86% and a sensitivity of 96.77%; rupture of the mucous membrane at the upper boundary of stenosis with a specificity of 100% and a sensitivity of 80.65%; cup-shaped suprastenotic dilatation with a specificity of 97.44% and a sensitivity of 54.84%; luminal mass with a specificity of 94.87% and a sensitivity of 87.10% and enlarged regional lymph nodes with a specificity of 82.86% and a sensitivity of 60%. All of these features were significantly more common in malignant than in benign esophageal stenosis (P < 0.05) (Figure 3).
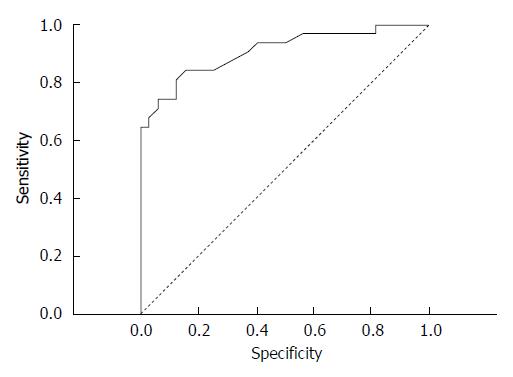
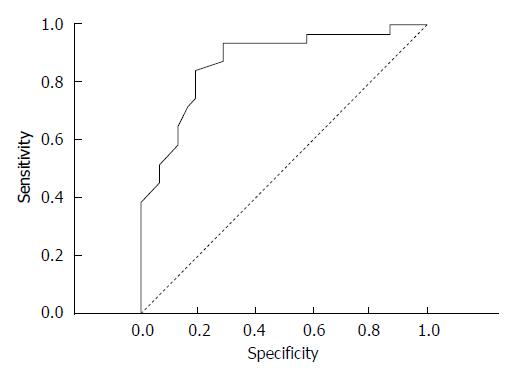
The correlation coefficient (r) between the CT attenuation value and group A was strong in the arterial phase (r = -0.736, P = 0.000) and average in the delayed phase (r = 0.579, P = 0.000), thus these features were suggested to be the most significant for differentiating benign esophageal stricture and esophageal cancer. Due to the strong negative correlation observed in the benign group, the mean CT attenuation value in the arterial phase was calculated in the malignant group [74.13 ± 17.42 HU (range, 34-105 HU)]. In the arterial phase, the mean CT attenuation value of background intact esophagus was 42.45 ± 8.18 HU (range, 24-60 HU) in all patients in groups A and B. The mean ΔCT in the arterial phase was 23.86 ± 19.31 HU. To distinguish esophageal carcinoma from the background normal esophageal walls, an ROC curve analysis for ΔCT was performed (Figure 4). An area under the curve of 0.883 ± 0.37 (95%CI: 1.77 to 10.5, P = 0.000) was revealed. Here, 11.5 HU of ΔCT was the cut-off value used to differentiate esophageal cancer from post-inflammatory stricture. Thus, the criterion of ΔCT greater than 11.5 HU in the arterial phase was optimal for diagnosing cancer, with a sensitivity of 83.87%, a specificity of 84.85%, a positive predictive value of 83.87%, a negative predictive value of 84.85% and an accuracy of 84.38%.
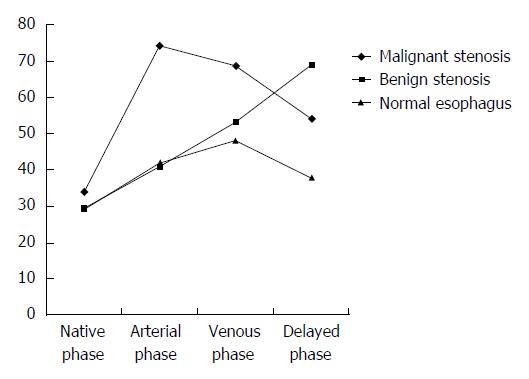
In delayed phase the mean CT attenuation value of the background intact esophagus was 38.39 ± 7.88 HU (range, 22-56 HU) in all patients in groups A and B. In group A, the mean CT attenuation value in delayed phase was 71.66 ± 14.28 HU (range, 51-104 HU), and the mean ΔCT was 34.03 ± 15.94 HU. To distinguish the post-inflammatory strictures from the background normal esophageal walls, a ROC curve analysis for ΔCT was performed (Figure 5). An area under the curve of 0.845 ± 0.42 (95%CI: 2.5-23.3 P < 0.0001) was revealed, and 18.5 HU of ΔCT was the cut-off value. Thus, a ΔCT value more than 18.5 HU in delayed phase was optimal for determining the benign nature of stenosis, with a sensitivity of 93.75%, a specificity of 70.96%, a positive predictive value of 76.92%, a negative predictive value of 70.97%, and an accuracy of 82.54%. The mean attenuation of stenosis in group B showed a peak in the arterial phase, and the mean attenuation of stenosis in group A showed a peak in the delayed phase, whereas the attenuation of the intact esophageal wall tended to gradually enhance (Figure 6).
The normal thickness of the esophageal wall is 3-5 mm, depending on its extension[1,9]. Esophageal stenosis develops and clinically manifests as dysphagia when thickening of esophageal walls occurs and its lumen narrows to less than 13 mm. Many diseases can cause esophageal stricture formation, including peptic acid, autoimmune, infectious, caustic, congenital, iatrogenic, medication-induced, radiation-induced, malignant, and idiopathic disease processes. Double-contrast esophagography and endoscopy are the two major diagnostic modalities for evaluating the esophagus.
The most optimal staging diagnostic modalities for esophageal cancer currently combine EUS-guided fine needle aspiration (EUS-FNA) with either CT or PET scans[11-12]. EUS is important for tumor depth (T staging) and for regional lymph nodes (N staging) evaluation. Specificity of EUS for N staging increases by the use of EUS-FNA for lymph node cytology. But EUS examination is limited by tumors which obstruct the esophageal lumen. Up to 45% of tumors are non-traversable (most of these are T3-T4)[13]. In these cases dilation of esophageal lumen or the use of high frequency miniprobe ultrasound through an upper endoscope helps to overcome this limitation and is useful for staging of an obstructing tumor.
Although CT plays a significant role in the diagnosis and TNM staging of esophageal cancer[14-17], the CT findings obtained for post-inflammatory strictures are not well described in the radiology literature.
Esophageal wall thickening is a nonspecific response to various diseases[10]. The major objective in the CT assessment of unexplained esophageal wall thickening is to establish whether its cause is benign or malignant. Differential diagnosis of esophageal stenosis of various etiologies has been reported in the literature[6,18-20]. However, doubt may occasionally arise (in 10% of cases) in the accuracy of the diagnosis, despite the well-known CT-criteria used for the differential diagnosis of esophageal stenosis[4]. In this study we used MDCT with two-phase bolus contrast enhancement and hydro-CT to assess the capabilities of MDCT in the differential diagnosis of chronic inflammatory and tumor-induced changes in the esophagus. In our study, new features proved to be useful for determining esophageal stenosis in patients with post-inflammatory strictures.
We analysed the patients of in groups A and B with a variety of CT-findings that were repeated from patient to patient and identified the most significant features. Esophageal cancer is characterized by asymmetric wall thickening and the active accumulation of contrast medium during the arterial phase. Eccentric esophageal wall thickening, absence of the mucous membrane visualization in the stenosis, rupture of the mucous membrane at the upper boundary of stenosis, cup-shaped suprastenotic dilatation, tuberous boundaries of stenosis and luminal mass are most likely due to newly formed tumor tissue, which grows from the local area in the esophageal wall, destroys the mucosa and forms elevated borders of pathologically changed walls and luminal mass. However, cup-shaped suprastenotic dilatation was only found in 17 (54.8%) patients. These patients had T3 stage (9 patients), T4 stage (4 patients) or T1 and T2 stages (1 patient each) according to the TNM classification. Stage T1 and T2 esophageal cancer does not usually result in esophageal stenosis. This feature may be very helpful in diagnosing patients with moderate or significant stenosis. A pathologically high accumulation of the contrast medium in the arterial phase of bolus contrast enhancement occurred 10 s after a peak value in the aorta reached 120-150 HU. Our findings were consistent with those obtained in a study using triple-phase dynamic CT, where it was established that the maximum contrast enhancement of esophageal cancer occurred at the arterial phase of bolus contrast enhancement[19,21]. Clinically, the results of our study showed that the contrast-enhanced attenuation value within esophageal carcinoma was significantly higher than in the background normal esophageal wall in the arterial phase. Our findings suggested that the cut-off ΔCT of 11.5 HU in the arterial phase had high sensitivity, specificity, positive predictive value, negative predictive value and accuracy all of which were greater than 80%, in detecting esophageal cancer. Similar data were found in the research of Li et al[21]. Our findings also may be explained by the fact that esophageal carcinoma is typically hypervascular and that the formation of new arterial microvessels in tumors results in an increased enhanced attenuation value[22-24]. Therefore, the active accumulation of contrast medium in the arterial phase suggests the neoplastic origin of the stenosis, which was confirmed by our data.
Peptic stenosis is the most common cause of esophageal stenosis, and leads to the formation of 60%-70% of all benign strictures. Carrascosa et al[6] described peptic stenosis as short in length (less than 1 cm), with concentric esophageal wall thickening. Corrosive strictures can be variable in both length and number. We found these features to be insufficient, because in our research, 9 (29%) patients with esophageal cancer had concentric esophageal wall thickening and 3 (10%) patients with post-inflammatory strictures had eccentric esophageal wall thickening. Koehler et al[25] also noticed that malignant esophageal tumors may be manifested on CT because of concentric wall thickening. Gradual narrowing of the esophageal lumen occurs in chronic inflammatory stenoses and forms a conically shaped suprastenotic dilatation. Suprastenotic dilatation was found in most cases (87%) of benign stenosis with different thickness and length and is a very important feature that helps establish a correct diagnosis. The mucosa was often traceable in the arterial phase as a thin hyperintense line in the centre of hypodense thickened walls, caused by inflammation of the stricture (target sign) (Figure 4). Inside the stricture area, the mucosa can be frequently interrupted or may not be visualized when there is complete mucosal destruction. A “target sign” was found in the esophagus of 77% of the patients with post-inflammatory strictures. This sign is also typical of esophagitis[10]. We suggest that this feature is due to inflammation in the mucosa. A marked increase of attenuation in the post-inflammatory stricture in the delayed phase may be explained by the proliferation of fibrous tissue in its walls. It is well known that areas of delayed or prolonged enhancement in liver tumors at CT or magnetic resonance imaging correspond to fibrotic stroma at histopathologic examination[26-29]. In our research, fibrotic stroma was found in the histopathologic examination of all post-inflammatory strictures. The cut-off ΔCT of 18.5 HU in the delayed phase had high sensitivity, specificity, positive predictive value, negative predictive value and accuracy, all of which were greater than 70%, in the differential diagnosis of post-inflammatory stricture. Therefore, the CT attenuation value in delayed phase may be used as a criterion for discriminating benign stenosis from cancer.
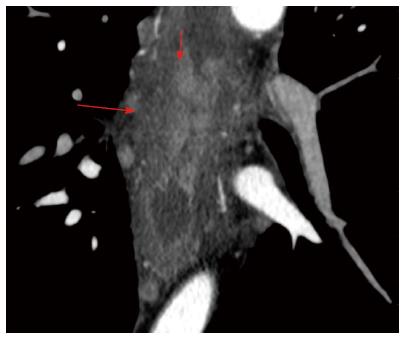
The analysis of the post-inflammatory esophageal strictures revealed, an intraluminal component in two cases, which simulated neoplastic transformation in the wall. In one case, there was a soft-tissue component with a uniform structure that showed delayed accumulation of contrast medium, which was thus considered a fibrous tissue. In the other case, the soft-tissue component showed an active accumulation of contrast medium during the arterial phase and lymph nodes were enlarged up to 13 mm, which suggested a tumor (Figure 5). However, during analysis, the margin between the hyperintense component and the surrounding hypodense fibrous layers of the wall was clearly traced, which suggested a mucosal granulation and consequently an inflammatory origin for the stricture (Figure 7).
The CT differentiation of benign and malignant stenosis is important because the specific diagnosis influences the treatment, including the necessity of surgery and the technique, or surgical approach that should be used as well as the need for lymph node dissection.
In addition, the results of the study showed a significant enlargement of the regional lymph nodes (diameter more than 10 mm), which was typically associated with the neoplastic transformation of the esophageal wall.
Our study has some limitations, as represented by the low number of studied patients. Selection bias is another inevitable component in a retrospective study. Another limitation is that the measurement of CT enhancement is a semi-quantitative method for assessing vascularity, and is significantly affected by the impact of patient cardiac output and central blood volume. To overcome this limitation, we measured the extent of CT enhancement within the stricture by subtracting the attenuation value of background intact esophageal walls from that of esophageal stenosis, which may help avoid the influence of cardiac output and central blood volume. The last limitation is that normal esophagus has thin walls and was thus more subject to partial volume averaging with adjacent paraesophageal fat tissue or air, which may have influenced the accuracy of the CT enhancement values measurements in the esophageal wall. To minimize this limitation, the measurements of CT enhancement were analysed on both thin-section and magnified images.
The correct diagnosis of benign or malignant stenosis in the esophagus is crucial for determining the appropriate treatment strategies. No detailed examination of the statistical significance of computed tomography (CT) findings of post-inflammatory esophageal strictures using two-phase dynamic multidetector CT (MDCT) has been published in the radiology literature. The authors’ findings would be of high practical importance to radiologists.
Corrosive and peptic strictures are characterized by morphologic and hemodynamic changes of the esophageal wall that occur due to chronic inflammation and result in fibrotic changes in the walls. To assess the typical changes in post-inflammatory strictures, the current research hotspot is the utilization of two-phase dynamic MDCT because both qualitative features, and perfusion changes can be quantitatively detected from contrast administration.
The characteristic CT appearances of esophageal stenosis of different etiologies have been described. Most previous studies have included unenhanced MDCT for evaluating the radiologic criteria of benign esophageal strictures. No detailed description of CT findings in post-inflammatory strictures has been published in the radiology literature. No study has analysed the value of MDCT with bolus contrast enhancement in the differential diagnosis of benign or malignant stenosis of esophagus. The authors reviewed data of two-phase dynamic MDCT in patients with benign and malignant stenosis and obtained qualitative and quantitative findings. They combined all such features and compared them with final histopathologic diagnoses. The most significant features in the differential diagnosis of post-inflammatory strictures from esophageal cancer were selected.
The features that were identified as significant for the CT evaluation of esophageal stenosis could be helpful in routine radiological practice and in treatment planning.
Ultrathin esophagoscopy is impossible if the esophageal lumen is less than 5 mm thick. Additionally, radiologic and endoscopic diagnoses are not informative if total obstruction of the esophageal lumen occurs. Therefore, two-phase dynamic MDCT could be an imaging modality of choice in cases of severe stenosis, because it allows for the evaluation of esophageal walls below the area of stenosis.
This is an interesting research study that evaluates the utility of two-phase dynamic MDCT to differentiate post-inflammatory esophageal strictures from esophageal cancer. The study is well structured; the subject is an actual one and could be helpful in routine radiological practice. The described imaging findings show high diagnostic significance in differentiation benign strictures from esophageal cancer.
P- Reviewer: Guo Y S- Editor: Qi Y L- Editor: A E- Editor: Wang CH
| 1. | Desai RK, Tagliabue JR, Wegryn SA, Einstein DM. CT evaluation of wall thickening in the alimentary tract. Radiographics. 1991;11:771-783; discussion 784. [PubMed] [DOI] [Cited in This Article: ] [Cited by in Crossref: 86] [Cited by in F6Publishing: 91] [Article Influence: 2.8] [Reference Citation Analysis (0)] |
| 2. | Reinig JW, Stanley JH, Schabel SI. CT evaluation of thickened esophageal walls. AJR Am J Roentgenol. 1983;140:931-934. [PubMed] [DOI] [Cited in This Article: ] [Cited by in Crossref: 40] [Cited by in F6Publishing: 40] [Article Influence: 1.0] [Reference Citation Analysis (0)] |
| 3. | Ba-Ssalamah A, Zacherl J, Noebauer-Huhmann IM, Uffmann M, Matzek WK, Pinker K, Herold C, Schima W. Dedicated multi-detector CT of the esophagus: spectrum of diseases. Abdom Imaging. 2009;34:3-18. [PubMed] [DOI] [Cited in This Article: ] [Cited by in Crossref: 51] [Cited by in F6Publishing: 53] [Article Influence: 3.5] [Reference Citation Analysis (0)] |
| 4. | Jang KM, Lee KS, Lee SJ, Kim EA, Kim TS, Han D, Shim YM. The spectrum of benign esophageal lesions: imaging findings. Korean J Radiol. 2002;3:199-210. [PubMed] [DOI] [Cited in This Article: ] [Cited by in Crossref: 47] [Cited by in F6Publishing: 54] [Article Influence: 2.6] [Reference Citation Analysis (0)] |
| 5. | Ella A, Barry H. Cardiopulmonary imaging. Philadelphia: Lippincott Williams and Wilkins 2004; 189-194. [Cited in This Article: ] |
| 6. | Carrascosa P, Capuñay C, Martín López E, Salis G, Mazzadi S, Carrascosa J. Esophageal stenosis: three-dimensional multidetector CT and virtual endoscopy. Abdom Imaging. 2009;34:19-25. [PubMed] [DOI] [Cited in This Article: ] [Cited by in Crossref: 9] [Cited by in F6Publishing: 7] [Article Influence: 0.4] [Reference Citation Analysis (0)] |
| 7. | Allen DC. Histopathology reporting. London: Springer-Verlag 2013; 3-15. [DOI] [Cited in This Article: ] |
| 8. | Takubo K. Pathology of the Esophagus 2nd Edition. Tokyo, Educa: Springer 2007; 49-56, 84-94. [Cited in This Article: ] |
| 9. | Dionigi G, Rovera F, Boni L, Bellani M, Bacuzzi A, Carrafiello G, Dionigi R. Cancer of the esophagus: the value of preoperative patient assessment. Expert Rev Anticancer Ther. 2006;6:581-593. [PubMed] [DOI] [Cited in This Article: ] [Cited by in Crossref: 3] [Cited by in F6Publishing: 5] [Article Influence: 0.3] [Reference Citation Analysis (0)] |
| 10. | Berkovich GY, Levine MS, Miller WT. CT findings in patients with esophagitis. AJR Am J Roentgenol. 2000;175:1431-1434. [PubMed] [DOI] [Cited in This Article: ] [Cited by in Crossref: 49] [Cited by in F6Publishing: 49] [Article Influence: 2.0] [Reference Citation Analysis (0)] |
| 11. | Vomackova K, Neoral C, Aujeský R, Vrba R, Stasek M, Myslivecek M, Formánek R. The benefit of PET/CT in the diagnosis and treatment of esophageal cancer. Rozhl Chir. 2015;94:8-16. [PubMed] [Cited in This Article: ] |
| 12. | Wani S, Das A, Rastogi A, Drahos J, Ricker W, Parsons R, Bansal A, Yen R, Hosford L, Jankowski M. Endoscopic ultrasonography in esophageal cancer leads to improved survival rates: results from a population-based study. Cancer. 2015;121:194-201. [PubMed] [DOI] [Cited in This Article: ] [Cited by in Crossref: 20] [Cited by in F6Publishing: 23] [Article Influence: 2.3] [Reference Citation Analysis (0)] |
| 13. | Khanna LG, Gress FG. Preoperative evaluation of oesophageal adenocarcinoma. Best Pract Res Clin Gastroenterol. 2015;29:179-191. [PubMed] [DOI] [Cited in This Article: ] [Cited by in Crossref: 10] [Cited by in F6Publishing: 12] [Article Influence: 1.3] [Reference Citation Analysis (0)] |
| 14. | Thompson WM, Halvorsen RA, Foster WL, Williford ME, Postlethwait RW, Korobkin M. Computed tomography for staging esophageal and gastroesophageal cancer: reevaluation. AJR Am J Roentgenol. 1983;141:951-958. [PubMed] [DOI] [Cited in This Article: ] [Cited by in Crossref: 86] [Cited by in F6Publishing: 86] [Article Influence: 2.1] [Reference Citation Analysis (0)] |
| 15. | Onbaş O, Eroglu A, Kantarci M, Polat P, Alper F, Karaoglanoglu N, Okur A. Preoperative staging of esophageal carcinoma with multidetector CT and virtual endoscopy. Eur J Radiol. 2006;57:90-95. [PubMed] [DOI] [Cited in This Article: ] [Cited by in Crossref: 25] [Cited by in F6Publishing: 27] [Article Influence: 1.4] [Reference Citation Analysis (0)] |
| 16. | Plukker JTM, Van Westreenen HL. Staging in oesophageal cancer. Res Clin Gastroenterol. 2006;20:877-891. [DOI] [Cited in This Article: ] [Cited by in Crossref: 21] [Cited by in F6Publishing: 25] [Article Influence: 1.4] [Reference Citation Analysis (0)] |
| 17. | Kim TJ, Kim HY, Lee KW, Kim MS. Multimodality assessment of esophageal cancer: preoperative staging and monitoring of response to therapy. Radiographics. 2009;29:403-421. [PubMed] [DOI] [Cited in This Article: ] [Cited by in Crossref: 123] [Cited by in F6Publishing: 100] [Article Influence: 6.7] [Reference Citation Analysis (0)] |
| 18. | Prokop M, Galanski M. Spiral and multislice: computed tomography of the body. Stuttgart: George Thieme Verlag 2003; 553-557. [Cited in This Article: ] |
| 19. | Umeoka S, Koyama T, Togashi K, Saga T, Watanabe G, Shimada Y, Imamura M. Esophageal cancer: evaluation with triple-phase dynamic CT--initial experience. Radiology. 2006;239:777-783. [PubMed] [DOI] [Cited in This Article: ] [Cited by in Crossref: 49] [Cited by in F6Publishing: 53] [Article Influence: 2.9] [Reference Citation Analysis (0)] |
| 20. | Jin GY, Park SH, Han YM. Usefulness of MDCT evaluation of the intraluminal surface of esophageal masses using only effervescent powder without injection of hypotonic agent. Abdom Imaging. 2009;34:424-429. [PubMed] [DOI] [Cited in This Article: ] [Cited by in Crossref: 9] [Cited by in F6Publishing: 8] [Article Influence: 0.5] [Reference Citation Analysis (0)] |
| 21. | Li R, Chen TW, Wang LY, Zhou L, Li H, Chen XL, Li CP, Zhang XM, Xiao RH. Quantitative measurement of contrast enhancement of esophageal squamous cell carcinoma on clinical MDCT. World J Radiol. 2012;4:179-185. [PubMed] [DOI] [Cited in This Article: ] [Cited by in CrossRef: 4] [Cited by in F6Publishing: 4] [Article Influence: 0.3] [Reference Citation Analysis (0)] |
| 22. | Lundsgaard Hansen M, Fallentin E, Lauridsen C, Law I, Federspiel B, Bæksgaard L, Svendsen LB, Nielsen MB. Computed tomography (CT) perfusion as an early predictive marker for treatment response to neoadjuvant chemotherapy in gastroesophageal junction cancer and gastric cancer--a prospective study. PLoS One. 2014;9:e97605. [PubMed] [DOI] [Cited in This Article: ] [Cited by in Crossref: 27] [Cited by in F6Publishing: 33] [Article Influence: 3.3] [Reference Citation Analysis (0)] |
| 23. | Chen TW, Yang ZG, Li Y, Li ZL, Yao J, Sun JY. Quantitative assessment of first-pass perfusion of oesophageal squamous cell carcinoma using 64-section MDCT: initial observation. Clin Radiol. 2009;64:38-45. [PubMed] [DOI] [Cited in This Article: ] [Cited by in Crossref: 18] [Cited by in F6Publishing: 20] [Article Influence: 1.3] [Reference Citation Analysis (0)] |
| 24. | Chen TW, Yang ZG, Wang QL, Li Y, Qian LL, Chen HJ. Whole tumour quantitative measurement of first-pass perfusion of oesophageal squamous cell carcinoma using 64-row multidetector computed tomography: correlation with microvessel density. Eur J Radiol. 2011;79:218-223. [PubMed] [DOI] [Cited in This Article: ] [Cited by in Crossref: 17] [Cited by in F6Publishing: 20] [Article Influence: 1.4] [Reference Citation Analysis (0)] |
| 25. | Koehler RE, Memel DS, Stanley RJ. Gastrointestinal tract. Computed body tomography with MRI correlation. 3rd ed. Philadelphia, Pa: Lippincott-Raven 1998; 649-653. [Cited in This Article: ] |
| 26. | Rubenstein WA, Gray G, Auh YH, Honig CL, Thorbjarnarson B, Williams JJ, Haimes AB, Zirinsky K, Kazam E. CT of fibrous tissues and tumors with sonographic correlation. AJR Am J Roentgenol. 1986;147:1067-1074. [PubMed] [DOI] [Cited in This Article: ] [Cited by in Crossref: 42] [Cited by in F6Publishing: 44] [Article Influence: 1.2] [Reference Citation Analysis (0)] |
| 27. | Yoshikawa J, Matsui O, Kadoya M, Gabata T, Arai K, Takashima T. Delayed enhancement of fibrotic areas in hepatic masses: CT-pathologic correlation. J Comput Assist Tomogr. 1992;16:206-211. [PubMed] [DOI] [Cited in This Article: ] [Cited by in Crossref: 85] [Cited by in F6Publishing: 87] [Article Influence: 2.7] [Reference Citation Analysis (0)] |
| 28. | Lacomis JM, Baron RL, Oliver JH, Nalesnik MA, Federle MP. Cholangiocarcinoma: delayed CT contrast enhancement patterns. Radiology. 1997;203:98-104. [PubMed] [DOI] [Cited in This Article: ] [Cited by in Crossref: 158] [Cited by in F6Publishing: 163] [Article Influence: 6.0] [Reference Citation Analysis (0)] |
| 29. | Asayama Y, Yoshimitsu K, Irie H, Tajima T, Nishie A, Hirakawa M, Nakayama T, Kakihara D, Taketomi A, Aishima S. Delayed-phase dynamic CT enhancement as a prognostic factor for mass-forming intrahepatic cholangiocarcinoma. Radiology. 2006;238:150-155. [PubMed] [DOI] [Cited in This Article: ] [Cited by in Crossref: 109] [Cited by in F6Publishing: 114] [Article Influence: 6.0] [Reference Citation Analysis (0)] |


