Copyright
©The Author(s) 2015.
World J Gastroenterol. Jul 14, 2015; 21(26): 8061-8072
Published online Jul 14, 2015. doi: 10.3748/wjg.v21.i26.8061
Published online Jul 14, 2015. doi: 10.3748/wjg.v21.i26.8061
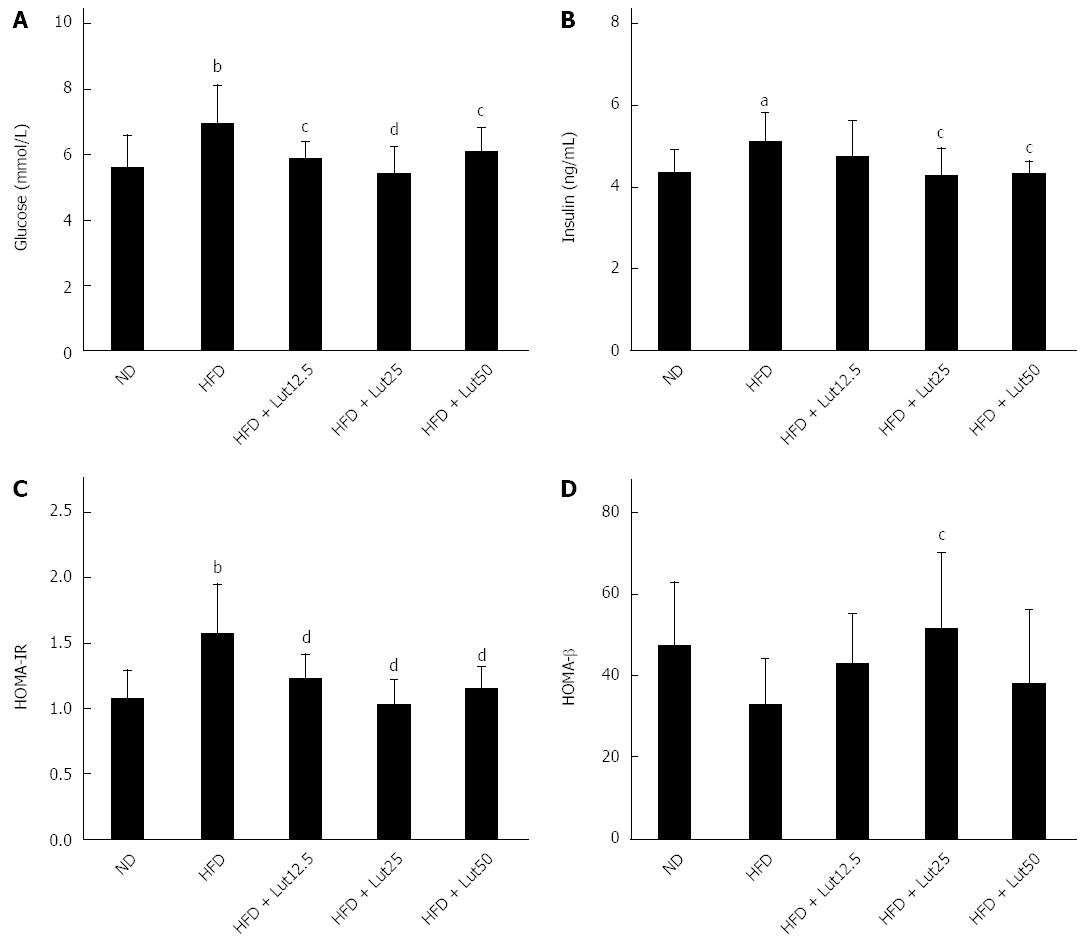
Figure 6 Lutein’s effect on fasting glucose (A), fasting insulin (B), HOMA-IR (C), and HOMA-β (D) in rats fed a high-fat diet.
After the 45-d lutein intervention, fasting glucose was tested as described and fasting insulin was measured using an insulin ELIZA kit following the manufacturer’s instructions. HOMA-IR = FIN × FPG/22.5, HOMA-β = 20 × FIN/(FPG-3.5). aP < 0.05, bP < 0.01 vs the normal diet (ND) group, cP < 0.05, dP < 0.01 vs high-fat diet (HFD) group. Data are expressed as the mean ± SD (n = 8).
- Citation: Qiu X, Gao DH, Xiang X, Xiong YF, Zhu TS, Liu LG, Sun XF, Hao LP. Ameliorative effects of lutein on non-alcoholic fatty liver disease in rats. World J Gastroenterol 2015; 21(26): 8061-8072
- URL: https://www.wjgnet.com/1007-9327/full/v21/i26/8061.htm
- DOI: https://dx.doi.org/10.3748/wjg.v21.i26.8061


