Copyright
©The Author(s) 2015.
World J Gastroenterol. Jul 14, 2015; 21(26): 8061-8072
Published online Jul 14, 2015. doi: 10.3748/wjg.v21.i26.8061
Published online Jul 14, 2015. doi: 10.3748/wjg.v21.i26.8061
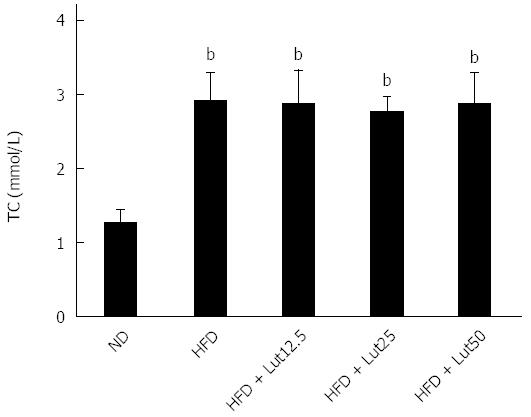
Figure 2 Levels of total cholesterol in rats divided into 4 groups.
Rats were fed with normal diet or a high fat diet for 10 d, and then the high fat diet (HFD)-fed rats were divided randomly into four groups based on total cholesterol. Data are expressed as the mean ± SD (n = 8). bP < 0.01 vs the normal diet (ND) group.
- Citation: Qiu X, Gao DH, Xiang X, Xiong YF, Zhu TS, Liu LG, Sun XF, Hao LP. Ameliorative effects of lutein on non-alcoholic fatty liver disease in rats. World J Gastroenterol 2015; 21(26): 8061-8072
- URL: https://www.wjgnet.com/1007-9327/full/v21/i26/8061.htm
- DOI: https://dx.doi.org/10.3748/wjg.v21.i26.8061


