Copyright
©The Author(s) 2015.
World J Gastroenterol. Jul 14, 2015; 21(26): 8032-8042
Published online Jul 14, 2015. doi: 10.3748/wjg.v21.i26.8032
Published online Jul 14, 2015. doi: 10.3748/wjg.v21.i26.8032
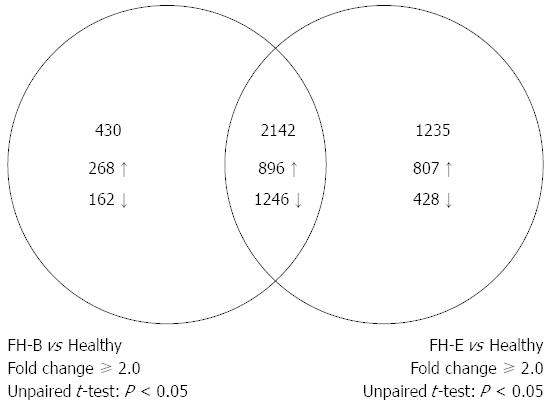
Figure 2 Venn-diagram showing comparison of number of entities differentially expressed in liver tissue from fulminant hepatitis B or E, as compared to healthy liver tissue.
The intersection of two circles shows entities that were differentially expressed in both fulminant hepatitis E and fulminant hepatitis B.
- Citation: Naik A, Goel A, Agrawal V, Sarangi AN, Chhavi N, Singh V, Jameel S, Aggarwal R. Changes in gene expression in liver tissue from patients with fulminant hepatitis E. World J Gastroenterol 2015; 21(26): 8032-8042
- URL: https://www.wjgnet.com/1007-9327/full/v21/i26/8032.htm
- DOI: https://dx.doi.org/10.3748/wjg.v21.i26.8032


