Copyright
©The Author(s) 2015.
World J Gastroenterol. Jul 14, 2015; 21(26): 8032-8042
Published online Jul 14, 2015. doi: 10.3748/wjg.v21.i26.8032
Published online Jul 14, 2015. doi: 10.3748/wjg.v21.i26.8032
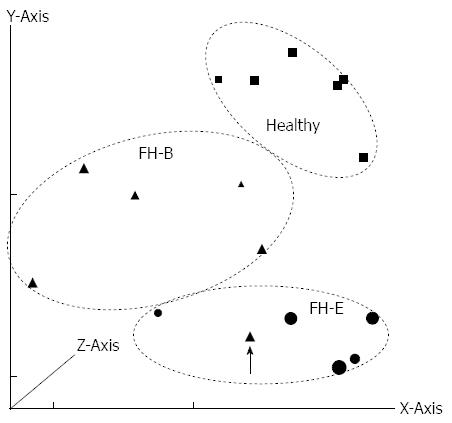
Figure 1 Principal component analysis of gene expression data from various specimens included in the study.
The components along X, Y and Z axes were 62.54%, 21.17%, and 8.88%, respectively. Patients with fulminant hepatitis E (FH-E) are represented using circles, those with fulminant hepatitis B (FH-B) using triangles and healthy controls using square symbols. The size of markers varies according to their placement on the Z axis. Patients with FH-E and FH-B clustered separately, except for one patient with FH-B who was an outlier (arrow).
- Citation: Naik A, Goel A, Agrawal V, Sarangi AN, Chhavi N, Singh V, Jameel S, Aggarwal R. Changes in gene expression in liver tissue from patients with fulminant hepatitis E. World J Gastroenterol 2015; 21(26): 8032-8042
- URL: https://www.wjgnet.com/1007-9327/full/v21/i26/8032.htm
- DOI: https://dx.doi.org/10.3748/wjg.v21.i26.8032


