Copyright
©The Author(s) 2015.
World J Gastroenterol. Jun 28, 2015; 21(24): 7529-7544
Published online Jun 28, 2015. doi: 10.3748/wjg.v21.i24.7529
Published online Jun 28, 2015. doi: 10.3748/wjg.v21.i24.7529
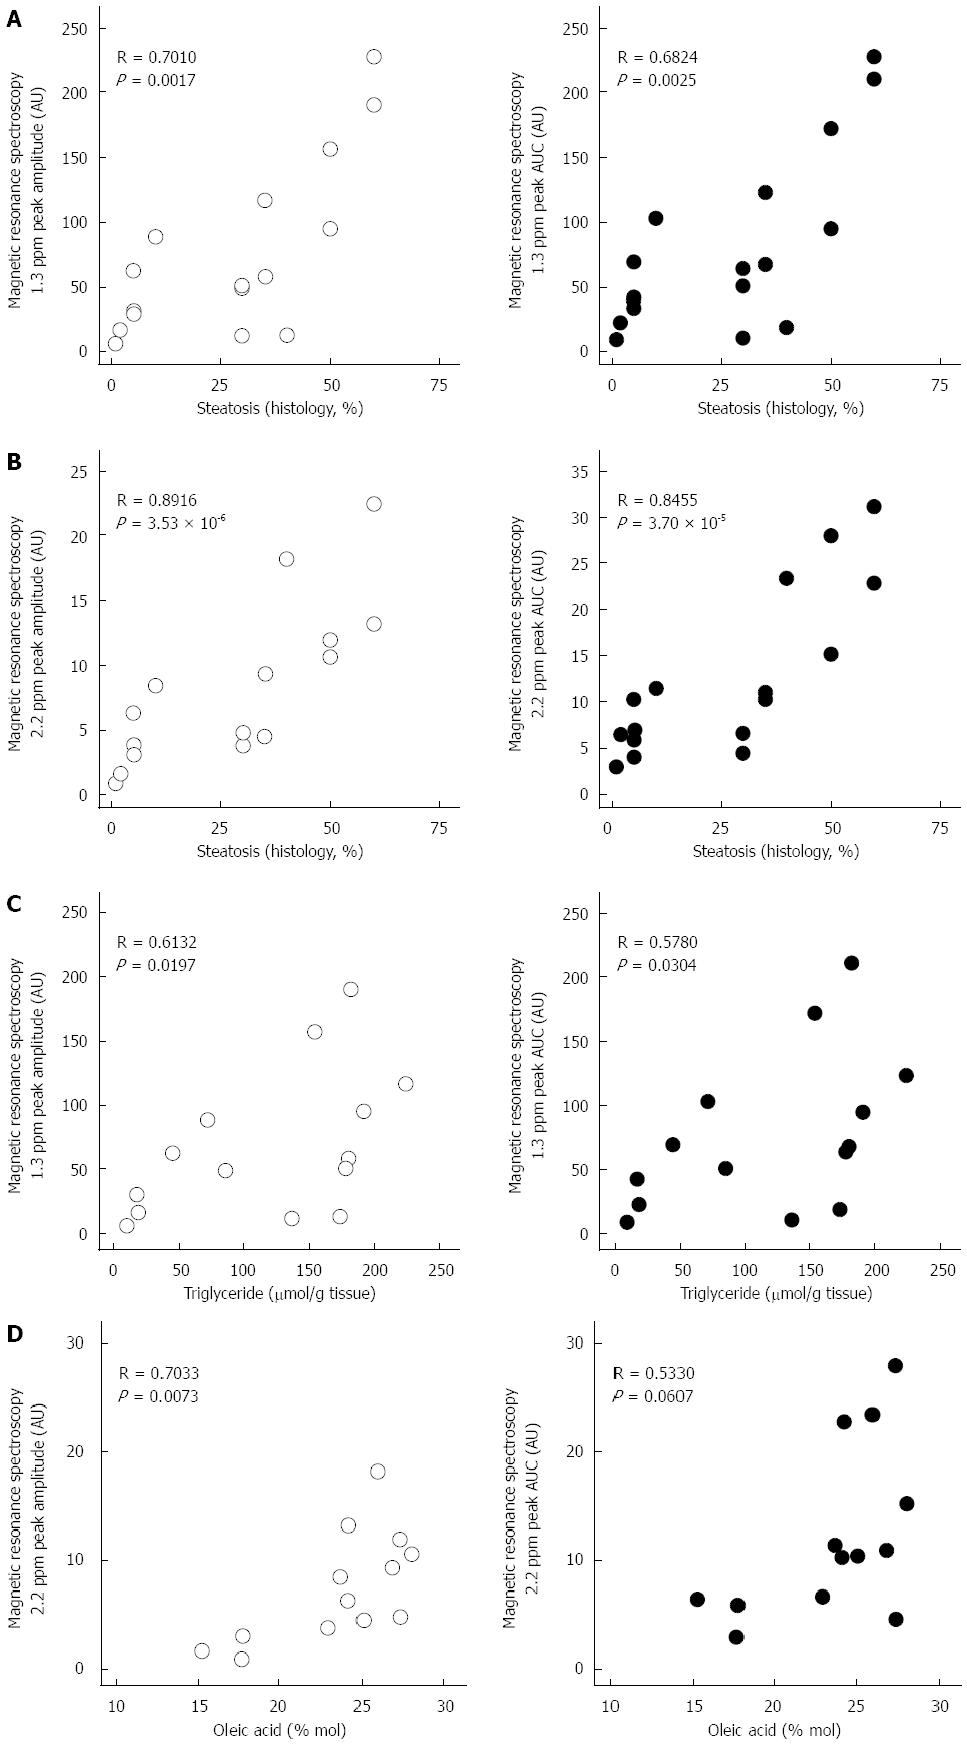
Figure 7 Similar results were obtained using the following methods of calculation: Amplitude of the peaks measurement (left open-circle plots) and area under the curve (AUC, right black-circle plots).
The most important peaks associated with fat are at 1.3 ppm (A) and 2.2 ppm (B). 1.3 ppm peak is mainly associated with triglycerides (C) while 2.2 ppm peak is associated with unsaturations (D).
- Citation: Calvo N, Beltrán-Debón R, Rodríguez-Gallego E, Hernández-Aguilera A, Guirro M, Mariné-Casadó R, Millá L, Alegret JM, Sabench F, del Castillo D, Vinaixa M, Rodríguez M&, Correig X, García-Álvarez R, Menendez JA, Camps J, Joven J. Liver fat deposition and mitochondrial dysfunction in morbid obesity: An approach combining metabolomics with liver imaging and histology. World J Gastroenterol 2015; 21(24): 7529-7544
- URL: https://www.wjgnet.com/1007-9327/full/v21/i24/7529.htm
- DOI: https://dx.doi.org/10.3748/wjg.v21.i24.7529


