Copyright
©The Author(s) 2015.
World J Gastroenterol. Jun 28, 2015; 21(24): 7529-7544
Published online Jun 28, 2015. doi: 10.3748/wjg.v21.i24.7529
Published online Jun 28, 2015. doi: 10.3748/wjg.v21.i24.7529
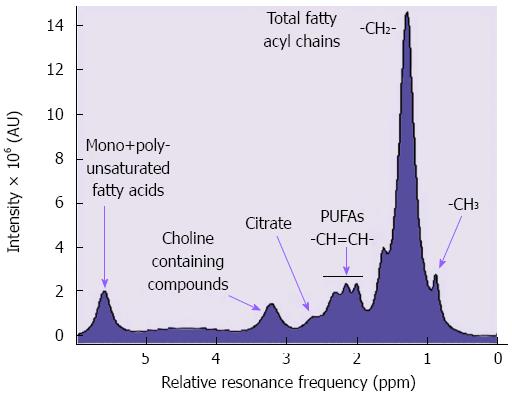
Figure 6 Representative spectrum of identifiable metabolites with magnetic resonance spectroscopy in vivo: 0.
9 ppm - terminal carbon (-CH3); 1.3 ppm - total fatty acyl chains (-CH2-); 2.0-2.2 ppm - poly-unsaturated fatty acids (-CH2=CH2-); 2.6 ppm -Citrate; 3.2 ppm - choline containing compounds; 5.3-5.6 ppm - mono+polyunsaturated fatty acids. Water relative resonance frequency appears at 4.7 ppm as major compound. In this case, water is suppressed for facilitate the visualization of other detectable compounds.
- Citation: Calvo N, Beltrán-Debón R, Rodríguez-Gallego E, Hernández-Aguilera A, Guirro M, Mariné-Casadó R, Millá L, Alegret JM, Sabench F, del Castillo D, Vinaixa M, Rodríguez M&, Correig X, García-Álvarez R, Menendez JA, Camps J, Joven J. Liver fat deposition and mitochondrial dysfunction in morbid obesity: An approach combining metabolomics with liver imaging and histology. World J Gastroenterol 2015; 21(24): 7529-7544
- URL: https://www.wjgnet.com/1007-9327/full/v21/i24/7529.htm
- DOI: https://dx.doi.org/10.3748/wjg.v21.i24.7529


