Copyright
©The Author(s) 2015.
World J Gastroenterol. Jun 28, 2015; 21(24): 7514-7521
Published online Jun 28, 2015. doi: 10.3748/wjg.v21.i24.7514
Published online Jun 28, 2015. doi: 10.3748/wjg.v21.i24.7514
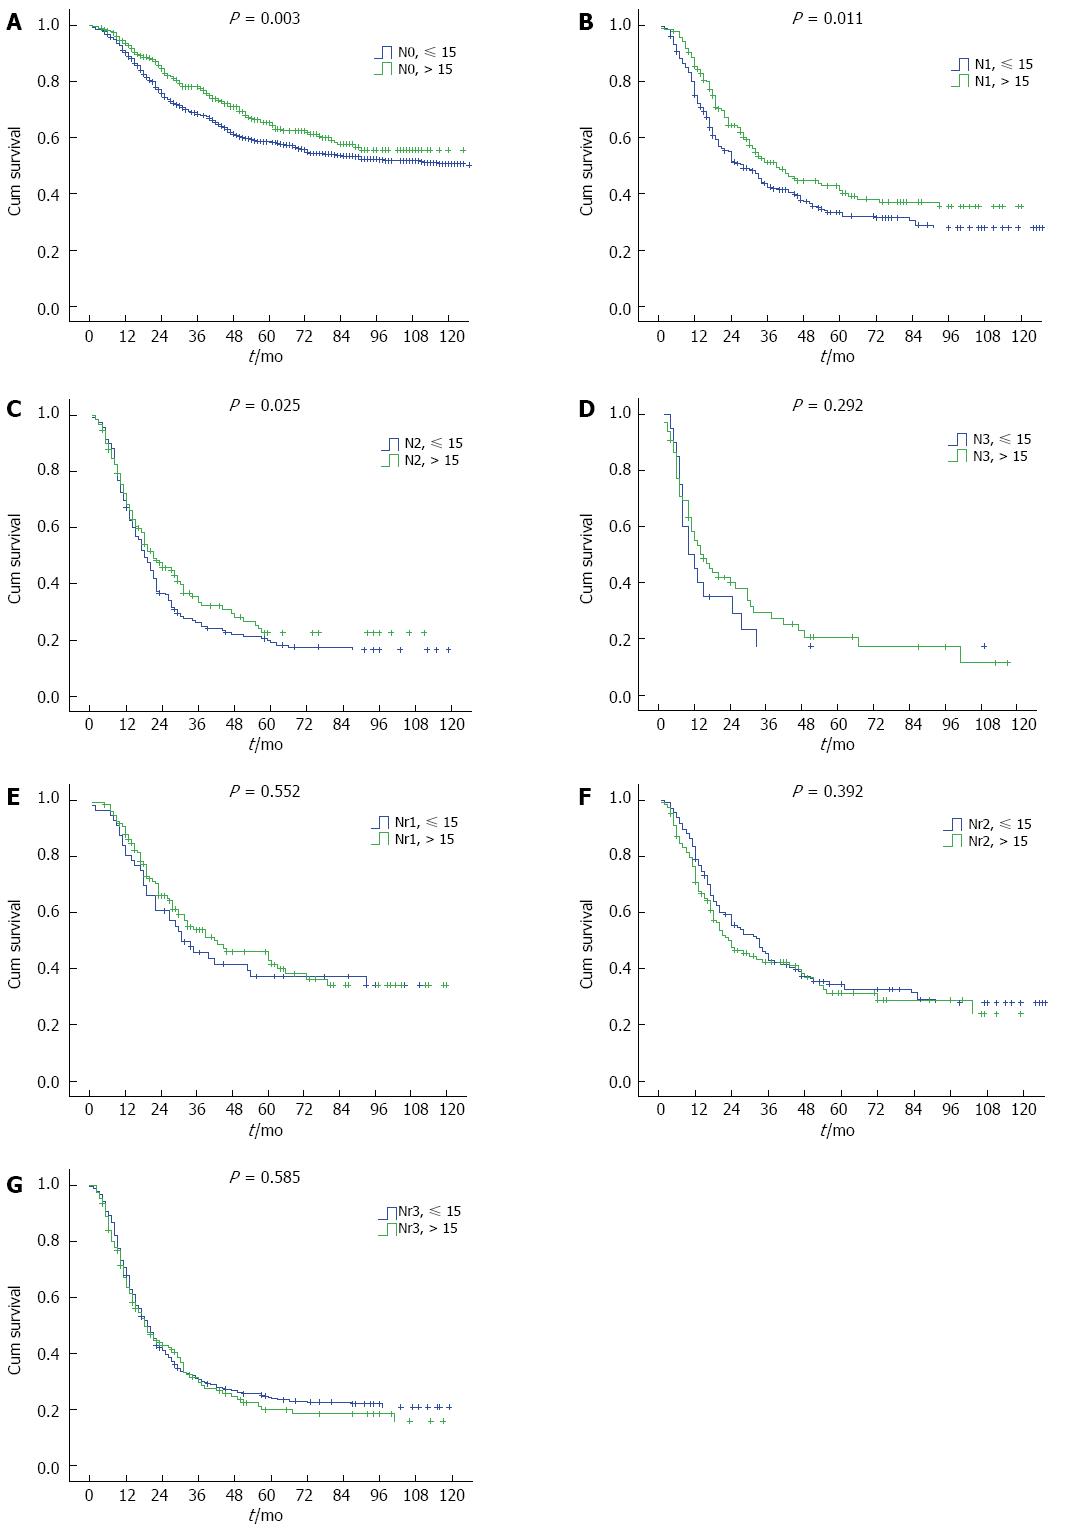
Figure 3 Kaplan-Meier curves for overall survival according to American Joint Committee on Cancer N categories and Nr categories, stratified by the number of examined nodes (< 15 and ≥ 15).
The survival differences were significant in the AJCC N categories (N0-N2, P < 0.05), except for N3 categories (P = 0.292). No significant difference was observed in the node ratio (Nr) categories (Nr1-N3).
- Citation: Chen SB, Weng HR, Wang G, Zou XF, Liu DT, Chen YP, Zhang H. Lymph node ratio-based staging system for esophageal squamous cell carcinoma. World J Gastroenterol 2015; 21(24): 7514-7521
- URL: https://www.wjgnet.com/1007-9327/full/v21/i24/7514.htm
- DOI: https://dx.doi.org/10.3748/wjg.v21.i24.7514


