Copyright
©The Author(s) 2015.
World J Gastroenterol. Jun 21, 2015; 21(23): 7165-7171
Published online Jun 21, 2015. doi: 10.3748/wjg.v21.i23.7165
Published online Jun 21, 2015. doi: 10.3748/wjg.v21.i23.7165
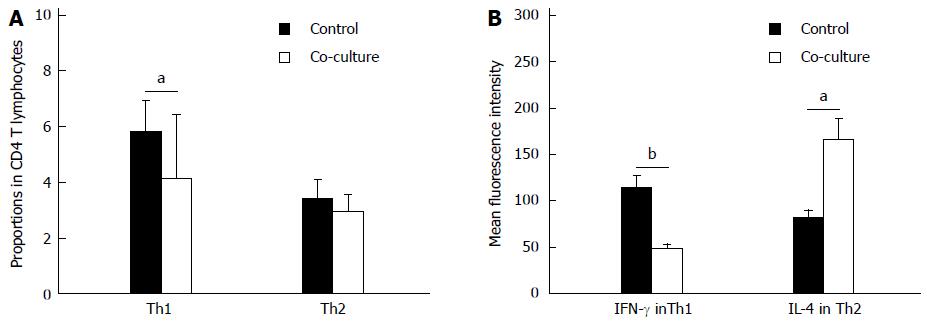
Figure 2 Effect of co-culturing on Th1/Th2 profile.
A: Proportion of CD4+ T lymphocytes identified as Th1 and Th2 cells; B: Mean fluorescence intensity of interferon (IFN)-γ in Th1 cells and interleukin (IL)-4 in Th2 cells assessed by flow cytometry when cultured alone or co-cultured for 48 h with activated hepatic stellate cells (n = 10). Data are expressed as mean ± SD. aP < 0.05, bP < 0.01 vs control.
-
Citation: Xing ZZ, Huang LY, Wu CR, You H, Ma H, Jia JD. Activated rat hepatic stellate cells influence Th1/Th2 profile
in vitro . World J Gastroenterol 2015; 21(23): 7165-7171 - URL: https://www.wjgnet.com/1007-9327/full/v21/i23/7165.htm
- DOI: https://dx.doi.org/10.3748/wjg.v21.i23.7165


