Copyright
©The Author(s) 2015.
World J Gastroenterol. Jun 7, 2015; 21(21): 6736-6744
Published online Jun 7, 2015. doi: 10.3748/wjg.v21.i21.6736
Published online Jun 7, 2015. doi: 10.3748/wjg.v21.i21.6736
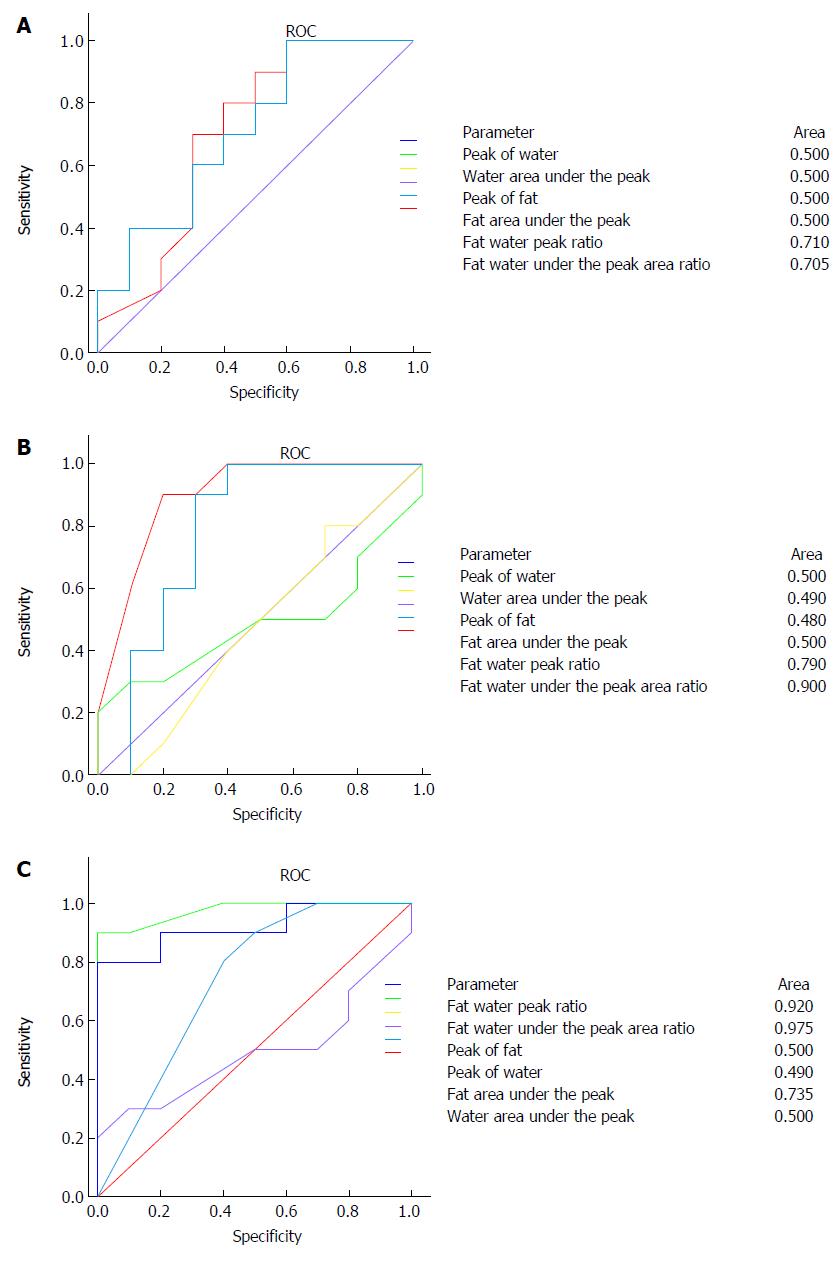
Figure 3 1H magnetic resonance spectroscopy of different groups of nonalcoholic fatty liver disease.
A: 1H magnetic resonance spectroscopy (1H MRS) of no vs mild fatty liver groups; B: 1H MRS of mild vs moderate fatty liver groups; C: 1H MRS of moderate vs severe fatty liver groups.
- Citation: Zhang Q, Zhang HM, Qi WQ, Zhang YG, Zhao P, Jiao J, Wang JB, Zhang CY. 3.0T 1H magnetic resonance spectroscopy for assessment of steatosis in patients with chronic hepatitis C. World J Gastroenterol 2015; 21(21): 6736-6744
- URL: https://www.wjgnet.com/1007-9327/full/v21/i21/6736.htm
- DOI: https://dx.doi.org/10.3748/wjg.v21.i21.6736


