Copyright
©The Author(s) 2015.
World J Gastroenterol. Jun 7, 2015; 21(21): 6649-6659
Published online Jun 7, 2015. doi: 10.3748/wjg.v21.i21.6649
Published online Jun 7, 2015. doi: 10.3748/wjg.v21.i21.6649
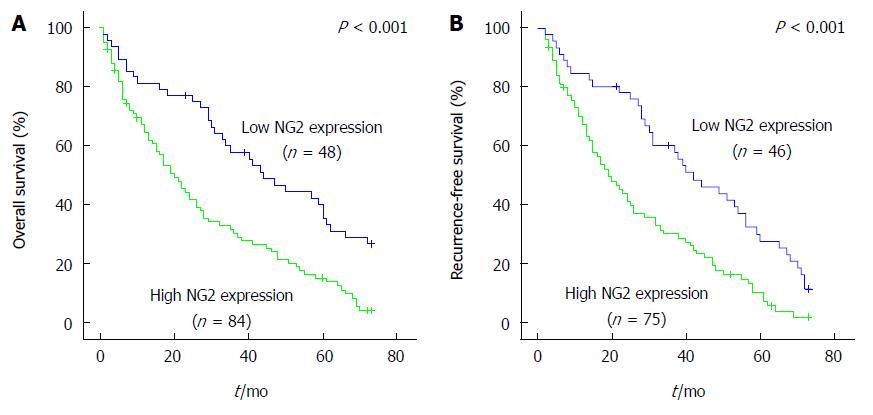
Figure 4 Kaplan-Meier curves of overall survival (A) and disease-free survival (B) based on neuron-glial antigen 2 expression in hepatocellular carcinoma patients.
The P-values were determined using the log-rank test.
- Citation: Lu LL, Sun J, Lai JJ, Jiang Y, Bai LH, Zhang LD. Neuron-glial antigen 2 overexpression in hepatocellular carcinoma predicts poor prognosis. World J Gastroenterol 2015; 21(21): 6649-6659
- URL: https://www.wjgnet.com/1007-9327/full/v21/i21/6649.htm
- DOI: https://dx.doi.org/10.3748/wjg.v21.i21.6649


