Copyright
©The Author(s) 2015.
World J Gastroenterol. Jun 7, 2015; 21(21): 6604-6612
Published online Jun 7, 2015. doi: 10.3748/wjg.v21.i21.6604
Published online Jun 7, 2015. doi: 10.3748/wjg.v21.i21.6604
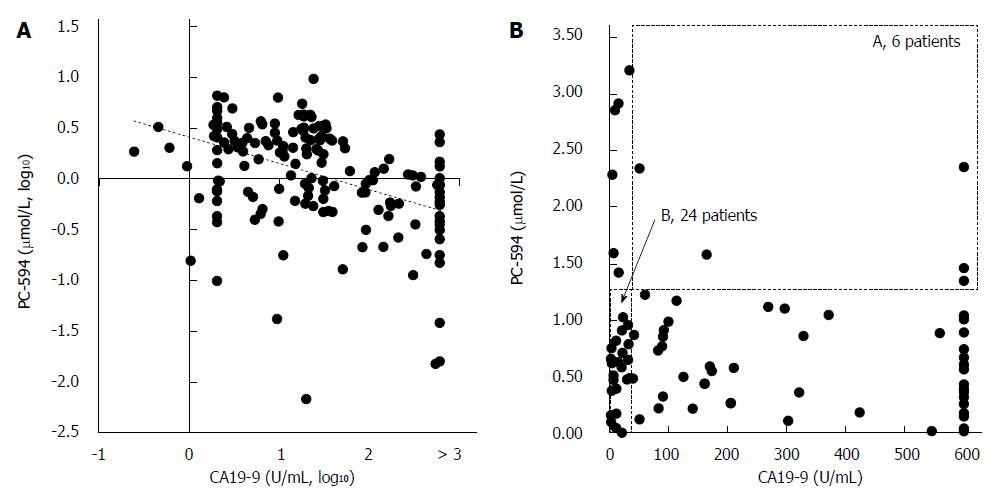
Figure 6 Correlation between CA19-9 and PC-594.
Scatter plots of PC-594 vs CA19-9 concentrations (A, log10; B, unlogged). In B, the dotted box A represents CA19-9 above 35 U/mL and PC-594 levels above 1.25 (elevated CA19-9 and normal PC-594), while the dotted box B represents CA19-9 levels below 35 U/mL and PC-594 levels below 1.25 (normal CA19-9 and abnormal PC-594).
- Citation: Ritchie SA, Chitou B, Zheng Q, Jayasinghe D, Jin W, Mochizuki A, Goodenowe DB. Pancreatic cancer serum biomarker PC-594: Diagnostic performance and comparison to CA19-9. World J Gastroenterol 2015; 21(21): 6604-6612
- URL: https://www.wjgnet.com/1007-9327/full/v21/i21/6604.htm
- DOI: https://dx.doi.org/10.3748/wjg.v21.i21.6604


