Copyright
©The Author(s) 2015.
World J Gastroenterol. Jun 7, 2015; 21(21): 6434-6443
Published online Jun 7, 2015. doi: 10.3748/wjg.v21.i21.6434
Published online Jun 7, 2015. doi: 10.3748/wjg.v21.i21.6434
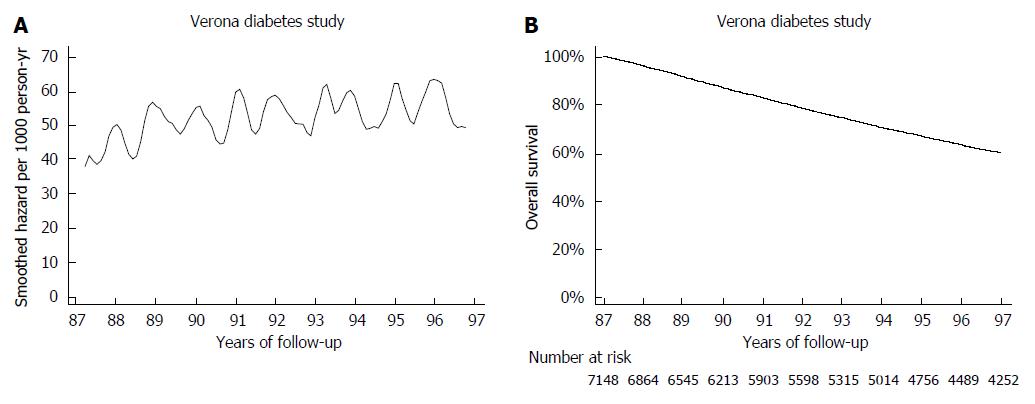
Figure 3 Temporal trend of all-cause mortality (A) and corresponding overall survival (B) in the 7148 type 2 diabetic patients from the Verona Diabetes Study.
To plot the estimated hazard function, a kernel smooth was used with a bandwidth of 1.5 mo. Survival curve was estimated by the Kaplan-Meier method.
- Citation: Verlato G, Marrelli D, Accordini S, Bencivenga M, Di Leo A, Marchet A, Petrioli R, Zoppini G, Muggeo M, Roviello F, de Manzoni G. Short-term and long-term risk factors in gastric cancer. World J Gastroenterol 2015; 21(21): 6434-6443
- URL: https://www.wjgnet.com/1007-9327/full/v21/i21/6434.htm
- DOI: https://dx.doi.org/10.3748/wjg.v21.i21.6434


