Copyright
©The Author(s) 2015.
World J Gastroenterol. May 28, 2015; 21(20): 6194-6205
Published online May 28, 2015. doi: 10.3748/wjg.v21.i20.6194
Published online May 28, 2015. doi: 10.3748/wjg.v21.i20.6194
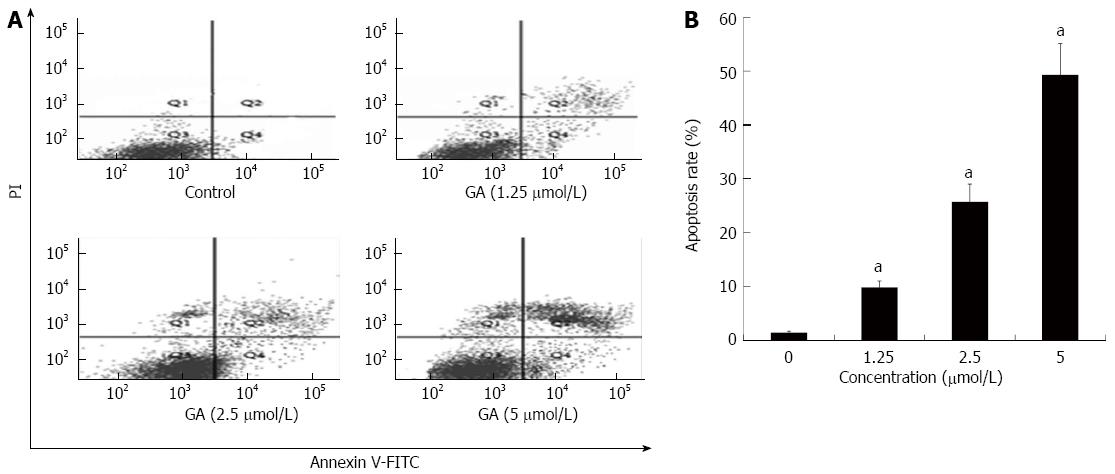
Figure 4 Quantification of gambogic acid-induced apoptosis by flow cytometry.
A: HT-29 cells were treated for 48 h and sorted by flow cytometry to detect early (FITC-stained, lower right quadrant) and late [FITC- and propidium iodide (PI)-stained, upper right quadrant] apoptotic cells; B: The experiment was repeated three times and the average percentage of apoptotic cells (mean ± SE) is shown. aP < 0.05 vs 0 μmol/L. GA: Gambogic acid.
-
Citation: Huang GM, Sun Y, Ge X, Wan X, Li CB. Gambogic acid induces apoptosis and inhibits colorectal tumor growth
via mitochondrial pathways. World J Gastroenterol 2015; 21(20): 6194-6205 - URL: https://www.wjgnet.com/1007-9327/full/v21/i20/6194.htm
- DOI: https://dx.doi.org/10.3748/wjg.v21.i20.6194


