Copyright
©The Author(s) 2015.
World J Gastroenterol. May 28, 2015; 21(20): 6167-6179
Published online May 28, 2015. doi: 10.3748/wjg.v21.i20.6167
Published online May 28, 2015. doi: 10.3748/wjg.v21.i20.6167
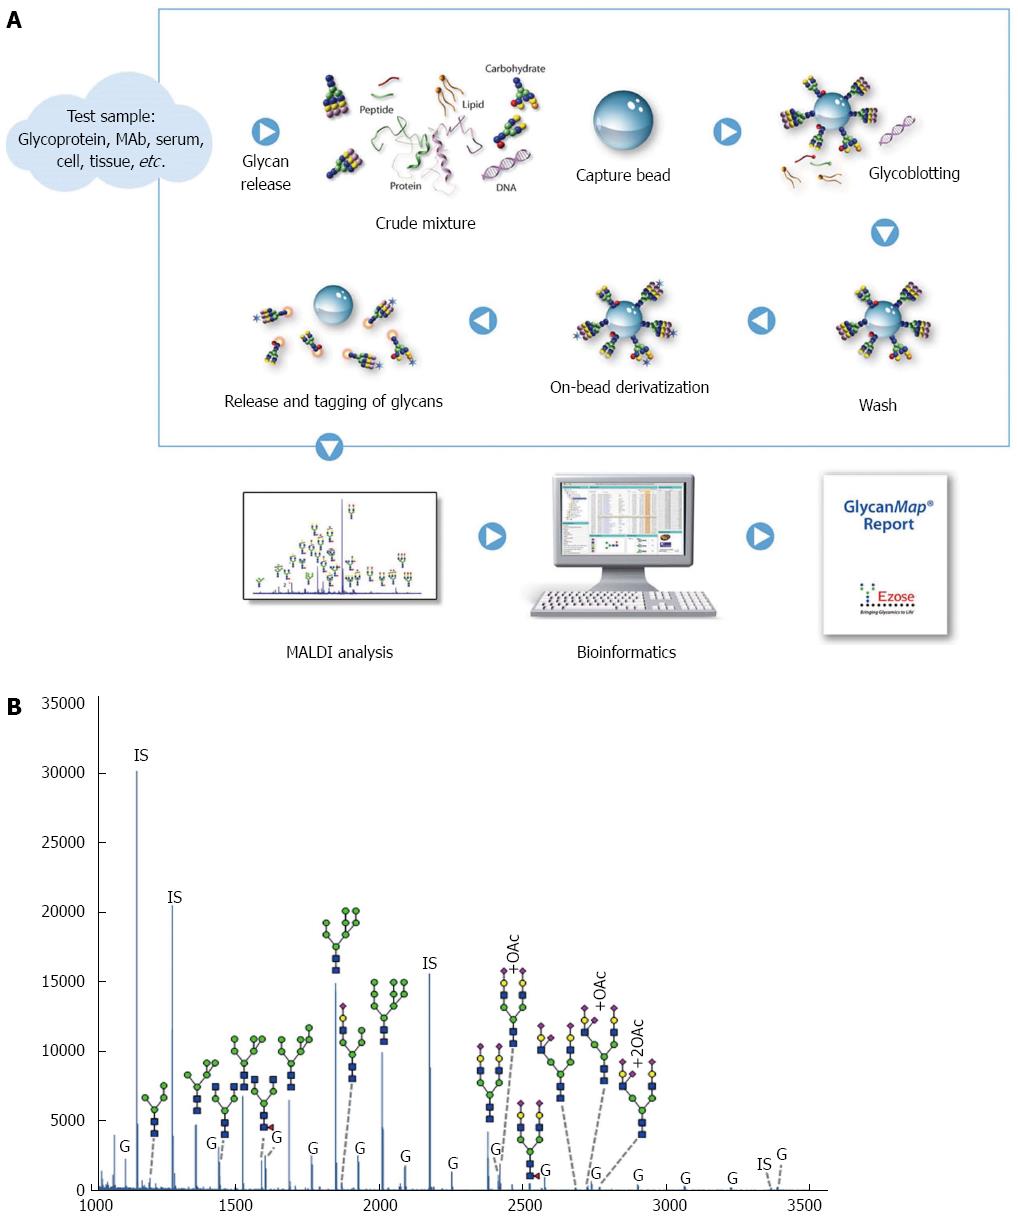
Figure 1 GlycanMap workflow.
A: Workflow; B: Glycan profile in rat liver lysates. The spectrum was generated from sample N5 and is representative of the N-glycan profile in rat liver lysates. Taking advantage of the symbol nomenclature of the Consortium for Functional Glycomics, selected peaks were labeled with the proposed glycan structures. All spectra were collected on a MALDI-TOF mass spectrometer in reflection mode, which yields high mass accuracy and isotopic resolution for more accurate glycan identification. Glycans were quantified by comparing the peak intensity of each glycan-derived peak to those of the internal standards (IS). The liver lysates also contained varying amounts of glycogen (G).
- Citation: Amin A, Bashir A, Zaki N, McCarthy D, Ahmed S, Lotfy M. Insights into glycan biosynthesis in chemically-induced hepatocellular carcinoma in rats: A glycomic analysis. World J Gastroenterol 2015; 21(20): 6167-6179
- URL: https://www.wjgnet.com/1007-9327/full/v21/i20/6167.htm
- DOI: https://dx.doi.org/10.3748/wjg.v21.i20.6167


