Copyright
©The Author(s) 2015.
World J Gastroenterol. May 21, 2015; 21(19): 6018-6025
Published online May 21, 2015. doi: 10.3748/wjg.v21.i19.6018
Published online May 21, 2015. doi: 10.3748/wjg.v21.i19.6018
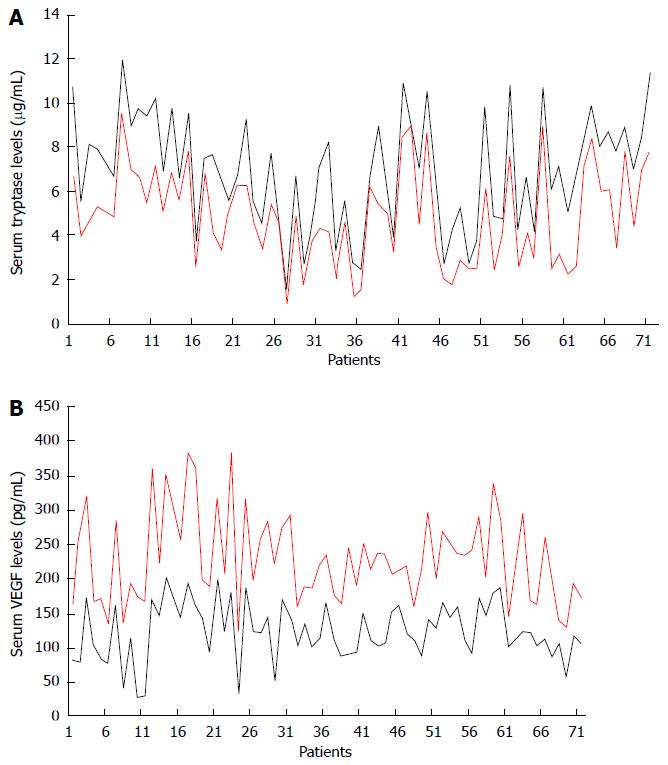
Figure 1 The levels of serum tryptase (A) and vascular endothelial growth factor (B) in patients.
A: Shows changes between serum tryptase levels before trans-arterial chemoembolization (TACE) (blue line) and serum tryptase levels after TACE (red line). A clear decreased concentration is showed for each patient after TACE; B: Shows changes between serum vascular endothelial growth factor (VEGF) levels before TACE (blue line) and serum VEGF levels after TACE (red line). A clear increased concentration is showed for each patient after vascular endothelial growth factor.
- Citation: Ranieri G, Ammendola M, Marech I, Laterza A, Abbate I, Oakley C, Vacca A, Sacco R, Gadaleta CD. Vascular endothelial growth factor and tryptase changes after chemoembolization in hepatocarcinoma patients. World J Gastroenterol 2015; 21(19): 6018-6025
- URL: https://www.wjgnet.com/1007-9327/full/v21/i19/6018.htm
- DOI: https://dx.doi.org/10.3748/wjg.v21.i19.6018


