Copyright
©The Author(s) 2015.
World J Gastroenterol. May 21, 2015; 21(19): 5843-5855
Published online May 21, 2015. doi: 10.3748/wjg.v21.i19.5843
Published online May 21, 2015. doi: 10.3748/wjg.v21.i19.5843
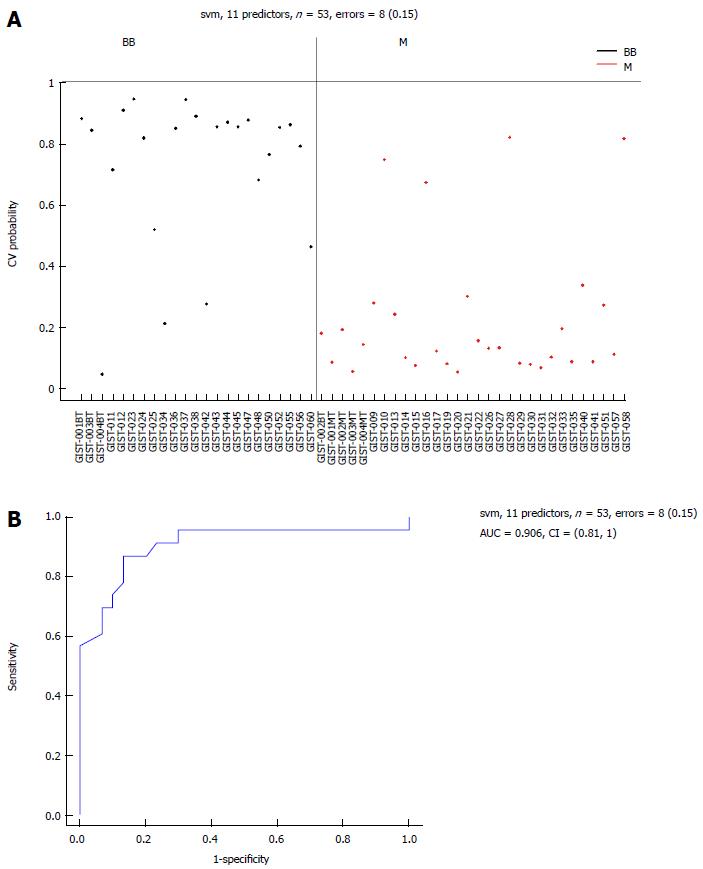
Figure 7 Area-under-the-curve (0.
906) estimation for the miRNA panel in the benign or borderline gastrointestinal stromal tumor tissues and M groups. Eleven selected miRNAs comparing the BB and M groups. A: Support vector machine (SVM) prediction probability for 53 samples with an error = 8 (0.15); B: Area-under-the-curve (AUC = 0.906) estimation for the miRNA panel in the BB and M groups. BB: Benign or borderline GIST tissues; M: Malignant GIST tissues; GIST: Gastrointestinal stromal tumor.
- Citation: Tong HX, Zhou YH, Hou YY, Zhang Y, Huang Y, Xie B, Wang JY, Jiang Q, He JY, Shao YB, Han WM, Tan RY, Zhu J, Lu WQ. Expression profile of microRNAs in gastrointestinal stromal tumors revealed by high throughput quantitative RT-PCR microarray. World J Gastroenterol 2015; 21(19): 5843-5855
- URL: https://www.wjgnet.com/1007-9327/full/v21/i19/5843.htm
- DOI: https://dx.doi.org/10.3748/wjg.v21.i19.5843


