Copyright
©The Author(s) 2015.
World J Gastroenterol. May 21, 2015; 21(19): 5843-5855
Published online May 21, 2015. doi: 10.3748/wjg.v21.i19.5843
Published online May 21, 2015. doi: 10.3748/wjg.v21.i19.5843
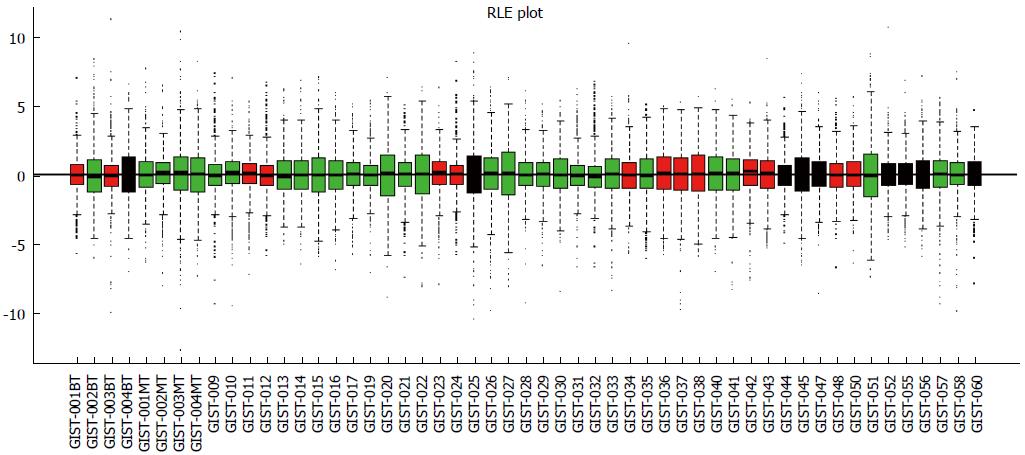
Figure 1 Relative log expression plot (quantile) of normalized data.
There were no significantly different profiles between samples. GIST: Gastrointestinal stromal tumor; RLE: Relative log expression.
- Citation: Tong HX, Zhou YH, Hou YY, Zhang Y, Huang Y, Xie B, Wang JY, Jiang Q, He JY, Shao YB, Han WM, Tan RY, Zhu J, Lu WQ. Expression profile of microRNAs in gastrointestinal stromal tumors revealed by high throughput quantitative RT-PCR microarray. World J Gastroenterol 2015; 21(19): 5843-5855
- URL: https://www.wjgnet.com/1007-9327/full/v21/i19/5843.htm
- DOI: https://dx.doi.org/10.3748/wjg.v21.i19.5843


