Copyright
©The Author(s) 2015.
World J Gastroenterol. May 21, 2015; 21(19): 5831-5842
Published online May 21, 2015. doi: 10.3748/wjg.v21.i19.5831
Published online May 21, 2015. doi: 10.3748/wjg.v21.i19.5831
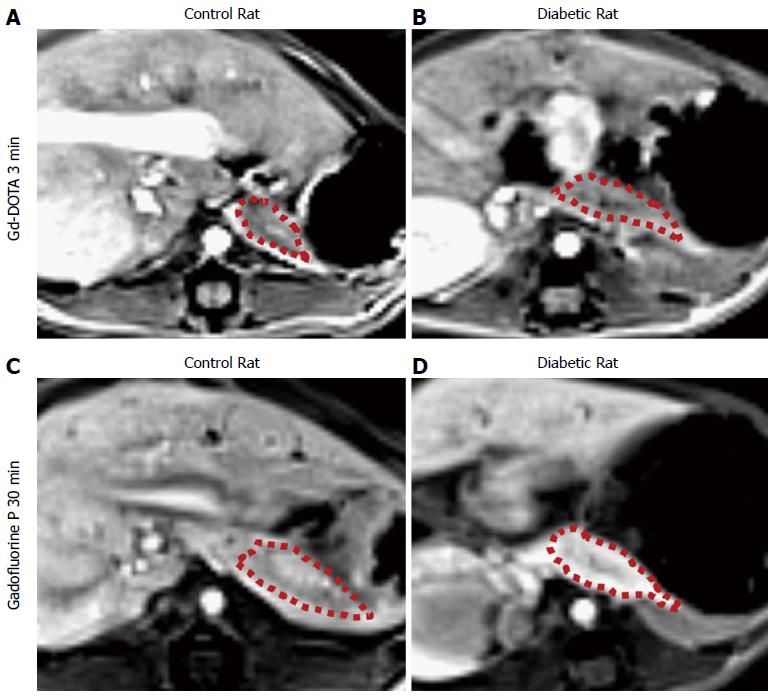
Figure 6 T1-weighted image magnetic resonance imaging obtained 3 min after Gd-DOTA injection and 30 min after Gadofluorine P injection and a diabetic rat (D) revealed the pancreas of a control rat (A), a diabetic rat (B), a control rat (C) and a diabetic rat (D), respectively.
The normalized SI and ER were as follows: a control vs a diabetic rat, 158.2 vs 153.2 and 14.7 vs 4.9, respectively. The normalized SI and ER were as follows: a control versus a diabetic rat, 212.5 vs 295.6 and 54.1 vs 102.3, respectively. The area of the pancreas is outlined with a red dotted line. MRI: Magnetic resonance imaging; SI: Signal intensity; ER: Enhancement ratio.
- Citation: Cho HR, Lee Y, Doble P, Bishop D, Hare D, Kim YJ, Kim KG, Jung HS, Park KS, Choi SH, Moon WK. Magnetic resonance imaging of the pancreas in streptozotocin-induced diabetic rats: Gadofluorine P and Gd-DOTA. World J Gastroenterol 2015; 21(19): 5831-5842
- URL: https://www.wjgnet.com/1007-9327/full/v21/i19/5831.htm
- DOI: https://dx.doi.org/10.3748/wjg.v21.i19.5831


