Copyright
©The Author(s) 2015.
World J Gastroenterol. May 14, 2015; 21(18): 5677-5684
Published online May 14, 2015. doi: 10.3748/wjg.v21.i18.5677
Published online May 14, 2015. doi: 10.3748/wjg.v21.i18.5677
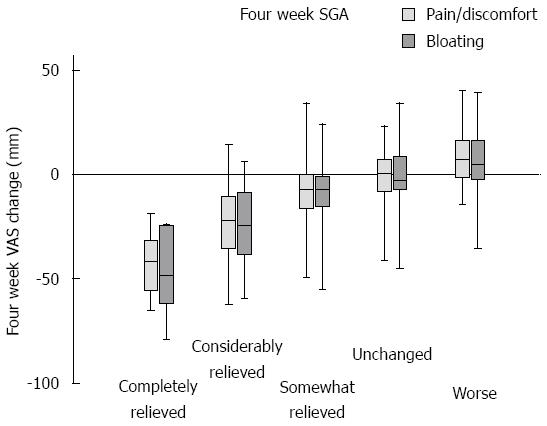
Figure 1 Scale and precision of the subjective global assessment measure.
At 4 wk, the change in VAS registration (compared to pre-registration values) was calculated. Box and whiskers plot of VAS change in the different subcategories of SGA at 4 wk. It is noted that the scale is not entirely linear, with best discrimination in the left part of the plot, while the right part shows smaller VAS differences between groups. SGA: Subjective global assessment; VAS: Visual analog scale.
- Citation: Berg LK, Fagerli E, Myhre AO, Florholmen J, Goll R. Self-reported dietary fructose intolerance in irritable bowel syndrome: Proposed diagnostic criteria. World J Gastroenterol 2015; 21(18): 5677-5684
- URL: https://www.wjgnet.com/1007-9327/full/v21/i18/5677.htm
- DOI: https://dx.doi.org/10.3748/wjg.v21.i18.5677


