Copyright
©The Author(s) 2015.
World J Gastroenterol. May 7, 2015; 21(17): 5259-5270
Published online May 7, 2015. doi: 10.3748/wjg.v21.i17.5259
Published online May 7, 2015. doi: 10.3748/wjg.v21.i17.5259
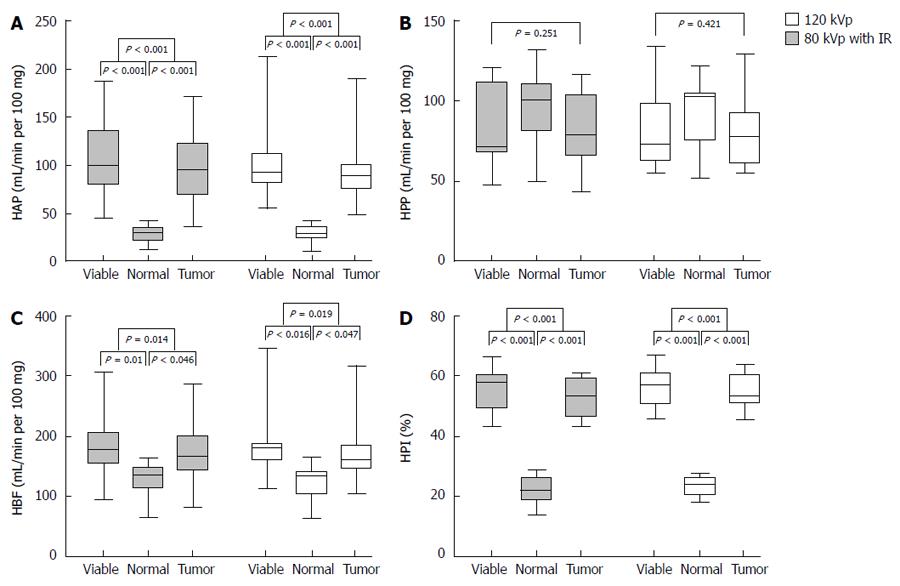
Figure 2 Box-and-whisker plots of hepatic arterial perfusion (A), hepatic portal perfusion (B), hepatic blood flow (C) and hepatic perfusion index (D) values were obtained with the 80 kVp protocol and iterative reconstruction and 120 kVp protocol to assess the difference in perfusion parameters among normal liver parenchyma, viable tumor and whole tumor (Donnut test, normal liver parenchyma set as control).
Center lines in box represent mean HAP, HPP, HBF and HPI values with upper and lower box margins denoting maximum and minimum percentile of values, respectively. Whiskers gives the range of values. IR: Iterative reconstruction; HAP: Hepatic arterial perfusion; HPP: Hepatic portal perfusion; HBP: Hepatic blood flow; HPI: Hepatic perfusion index; HBF: Hepatic blood flow.
- Citation: Zhang CY, Cui YF, Guo C, Cai J, Weng YF, Wang LJ, Wang DB. Low contrast medium and radiation dose for hepatic computed tomography perfusion of rabbit VX2 tumor. World J Gastroenterol 2015; 21(17): 5259-5270
- URL: https://www.wjgnet.com/1007-9327/full/v21/i17/5259.htm
- DOI: https://dx.doi.org/10.3748/wjg.v21.i17.5259


