Copyright
©The Author(s) 2015.
World J Gastroenterol. May 7, 2015; 21(17): 5259-5270
Published online May 7, 2015. doi: 10.3748/wjg.v21.i17.5259
Published online May 7, 2015. doi: 10.3748/wjg.v21.i17.5259
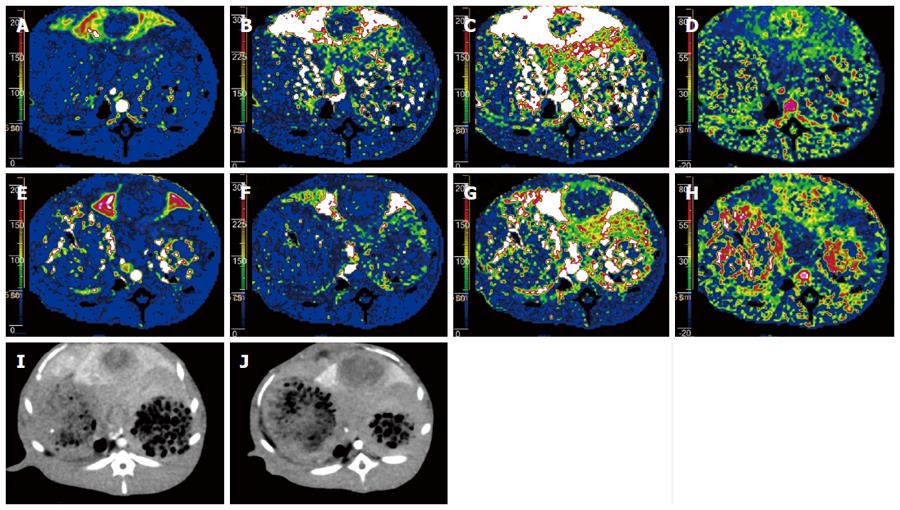
Figure 1 Computed tomography perfusions using both 80 kVp protocol with iterative reconstruction (4 mL Visipaque 270, 354.
1 mgI/kg) and 120 kVp protocol with filtered back projection (5 mL Omnipaque 350, 573.8 mgI/kg) at a 24-h interval were performed for liver VX2 tumor in a rabbit (body weight, 3.05 kg). A-D: Pseudocolor perfusion maps with the 80 kVp protocol and iterative reconstruction for HAP, HPP, HBF and HPI, respectively; E-H: Pseudocolor perfusion maps with the 120 kVp protocol and FBP for HAP, HPP, HBF, and HPI, respectively; I,J: Arterial phase images obtained using the 80 kVp protocol with iterative reconstruction and 120 kVp protocol reveal a markedly enhanced mass with central necrotic change, respectively. Computed tomography perfusion maps obtained using low tube potential with low concentration contrast medium depict a hypervascular mass with central hypovascular component, which is comparable to that obtained using the conventional tube potential and concentration contrast medium protocol. IR: Iterative reconstruction; FBP: Filtered back projection; HAP: Hepatic arterial perfusion; HPP: Hepatic portal perfusion; HBP: Hepatic blood flow; HPI: Hepatic perfusion index.
- Citation: Zhang CY, Cui YF, Guo C, Cai J, Weng YF, Wang LJ, Wang DB. Low contrast medium and radiation dose for hepatic computed tomography perfusion of rabbit VX2 tumor. World J Gastroenterol 2015; 21(17): 5259-5270
- URL: https://www.wjgnet.com/1007-9327/full/v21/i17/5259.htm
- DOI: https://dx.doi.org/10.3748/wjg.v21.i17.5259


