Copyright
©The Author(s) 2015.
World J Gastroenterol. Apr 28, 2015; 21(16): 4933-4945
Published online Apr 28, 2015. doi: 10.3748/wjg.v21.i16.4933
Published online Apr 28, 2015. doi: 10.3748/wjg.v21.i16.4933
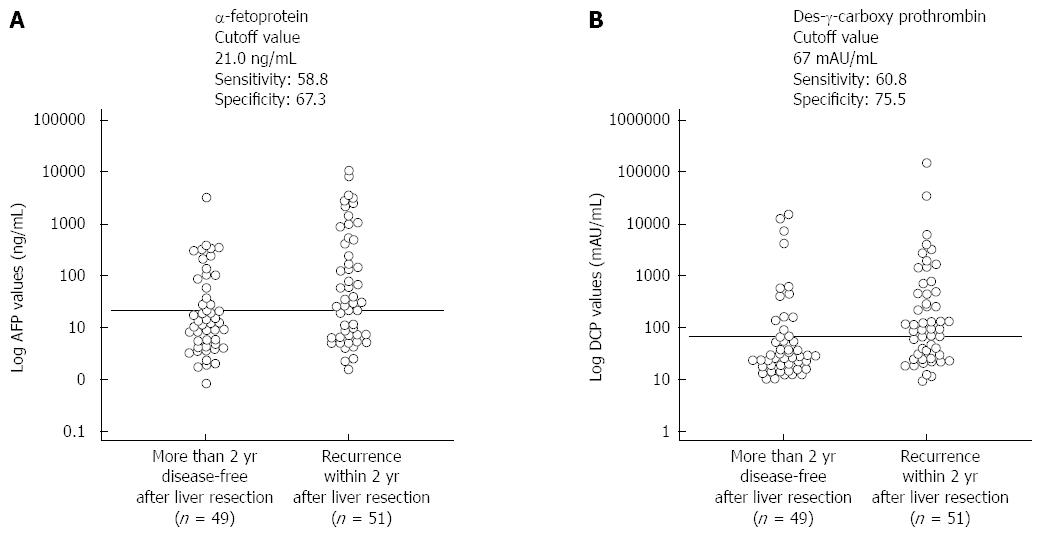
Figure 4 Interactive dot diagrams.
A: Interactive dot diagrams showing α-fetoprotein levels were used to predict recurrence within 2 years after hepatectomy among hepatocellular carcinoma patients with hepatitis C infection; B: Interactive dot diagrams showing des-γ-carboxy prothrombin levels were used to predict recurrence within 2 years after hepatectomy among hepatocellular carcinoma patients with hepatitis C infection. The horizontal line indicates the cutoff point with the best separation (minimal false-negative and false-positive results) between the two subgroups.
- Citation: Meguro M, Mizuguchi T, Nishidate T, Okita K, Ishii M, Ota S, Ueki T, Akizuki E, Hirata K. Prognostic roles of preoperative α-fetoprotein and des-γ-carboxy prothrombin in hepatocellular carcinoma patients. World J Gastroenterol 2015; 21(16): 4933-4945
- URL: https://www.wjgnet.com/1007-9327/full/v21/i16/4933.htm
- DOI: https://dx.doi.org/10.3748/wjg.v21.i16.4933


