Copyright
©The Author(s) 2015.
World J Gastroenterol. Apr 21, 2015; 21(15): 4765-4769
Published online Apr 21, 2015. doi: 10.3748/wjg.v21.i15.4765
Published online Apr 21, 2015. doi: 10.3748/wjg.v21.i15.4765
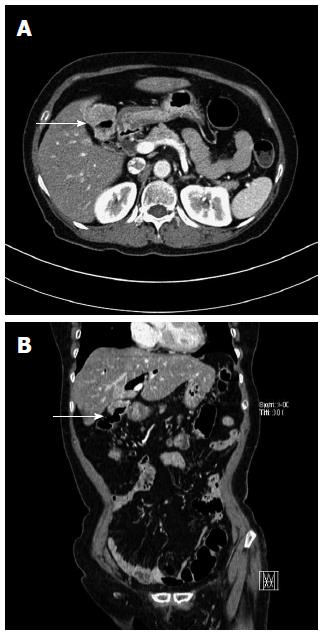
Figure 4 Contrast enhanced computed tomography images.
A: Axial computed tomography (CT) showed air-filled appearance of gallbladder along with thickening of the wall and well defined margin between the liver and the gallbladder (white arrow); B: Coronal CT showed the fistulous tract between gallbladder and hepatic flexure colon (white arrow), and pneumobilia.
- Citation: Ha GW, Lee MR, Kim JH. Cholecystocolic fistula caused by gallbladder carcinoma: Preoperatively misdiagnosed as hepatic colon carcinoma. World J Gastroenterol 2015; 21(15): 4765-4769
- URL: https://www.wjgnet.com/1007-9327/full/v21/i15/4765.htm
- DOI: https://dx.doi.org/10.3748/wjg.v21.i15.4765


