Copyright
©The Author(s) 2015.
World J Gastroenterol. Apr 21, 2015; 21(15): 4555-4563
Published online Apr 21, 2015. doi: 10.3748/wjg.v21.i15.4555
Published online Apr 21, 2015. doi: 10.3748/wjg.v21.i15.4555
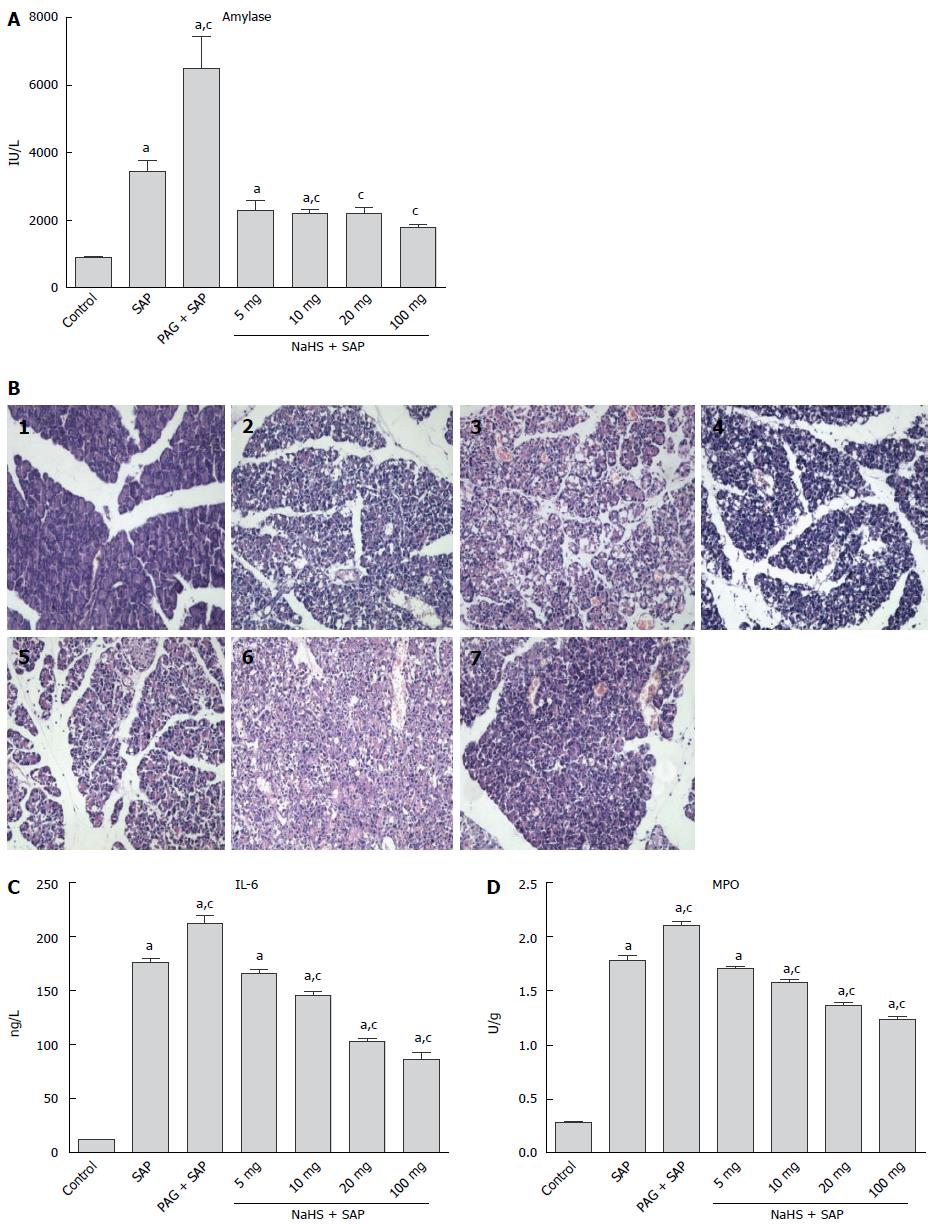
Figure 2 Levels of amylase, interleukin-6, and myeloperoxidase in pancreatic tissue.
A: Plasma amylase level; B: Pancretic histology (HE × 200) [1: Control (saline-injected) pancreas; 2: L-Arg-induced severe acute pancreatitis (the arrow indicates edema, destruction, histoarchitecture bleeding of the acini and the inflammatory cell infiltration); 3: Rats pre-administered PAG 50 mg/kg show more severe destruction and histoarchitecture bleeding of the acini and inflammatory cell infiltration; 4: Pretreatment with NaHS at 5 mg/kg; 5: Pretreatment with NaHS at 10 mg/kg; 6: Pretreatment with NaHS at 15 mg/kg; 7: Pretreatment with NaHS at 100 mg/kg]; C: Plasma IL-6 level; D: MPO activity in the pancreatic tissue. aP < 0.05 vs the control; cP < 0.05 vs the SAP group. PAG: Propargylglycine; MPO: Myeloperoxidase; SAP: Severe acute pancreatitis.
-
Citation: Rao CY, Fu LY, Hu CL, Chen DX, Gan T, Wang YC, Zhao XY. H2S mitigates severe acute pancreatitis through the PI3K/AKT-NF-κB pathway
in vivo . World J Gastroenterol 2015; 21(15): 4555-4563 - URL: https://www.wjgnet.com/1007-9327/full/v21/i15/4555.htm
- DOI: https://dx.doi.org/10.3748/wjg.v21.i15.4555


