Copyright
©The Author(s) 2015.
World J Gastroenterol. Apr 14, 2015; 21(14): 4310-4322
Published online Apr 14, 2015. doi: 10.3748/wjg.v21.i14.4310
Published online Apr 14, 2015. doi: 10.3748/wjg.v21.i14.4310
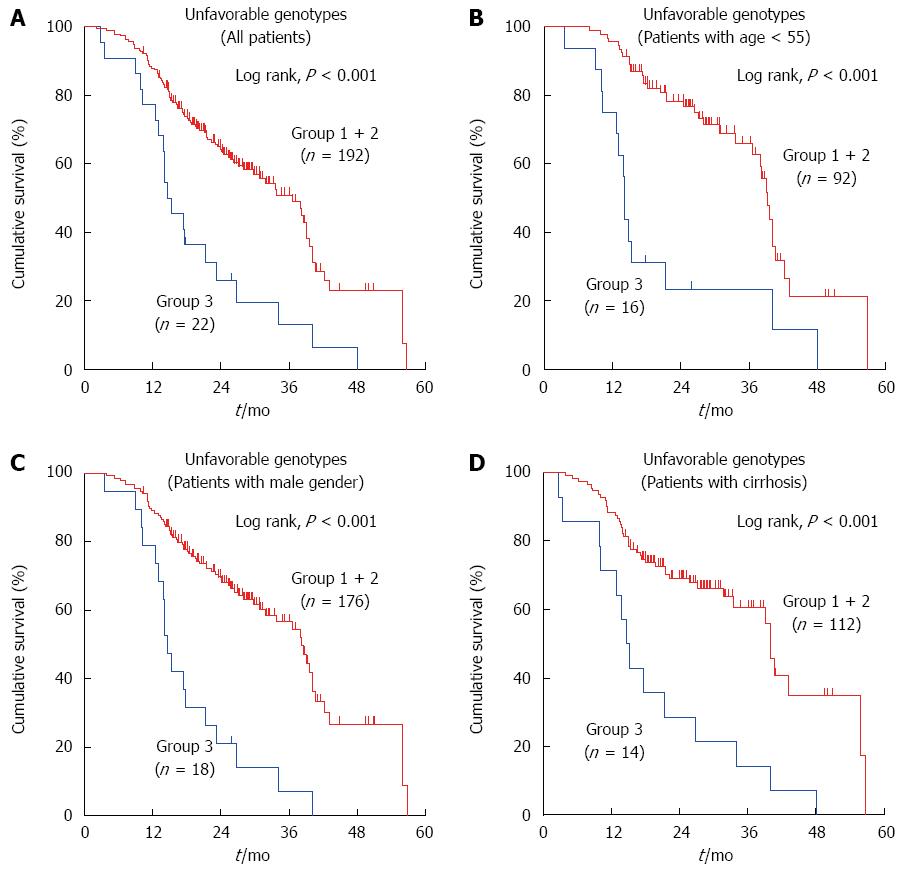
Figure 4 Kaplan-Meier curves for hepatocellular carcinoma patients carrying unfavorable genotypes.
A: In all patients; B: In patients with age < 55 years; C: In patients with male gender; D: In patients with cirrhosis. Patients were classified into two groups, according to number of unfavorable genotypes carried. Group 1 + 2 carried 0 or 1 unfavorable genotype, while Group 3 carried 2 unfavorable genotypes. Unfavorable genotypes were GSTO2: rs7085725 (WV or VV) and GSTP1: rs4147581 (WW).
- Citation: Qu K, Liu SS, Wang ZX, Huang ZC, Liu SN, Chang HL, Xu XS, Lin T, Dong YF, Liu C. Polymorphisms of glutathione S-transferase genes and survival of resected hepatocellular carcinoma patients. World J Gastroenterol 2015; 21(14): 4310-4322
- URL: https://www.wjgnet.com/1007-9327/full/v21/i14/4310.htm
- DOI: https://dx.doi.org/10.3748/wjg.v21.i14.4310


