Copyright
©The Author(s) 2015.
World J Gastroenterol. Apr 14, 2015; 21(14): 4216-4224
Published online Apr 14, 2015. doi: 10.3748/wjg.v21.i14.4216
Published online Apr 14, 2015. doi: 10.3748/wjg.v21.i14.4216
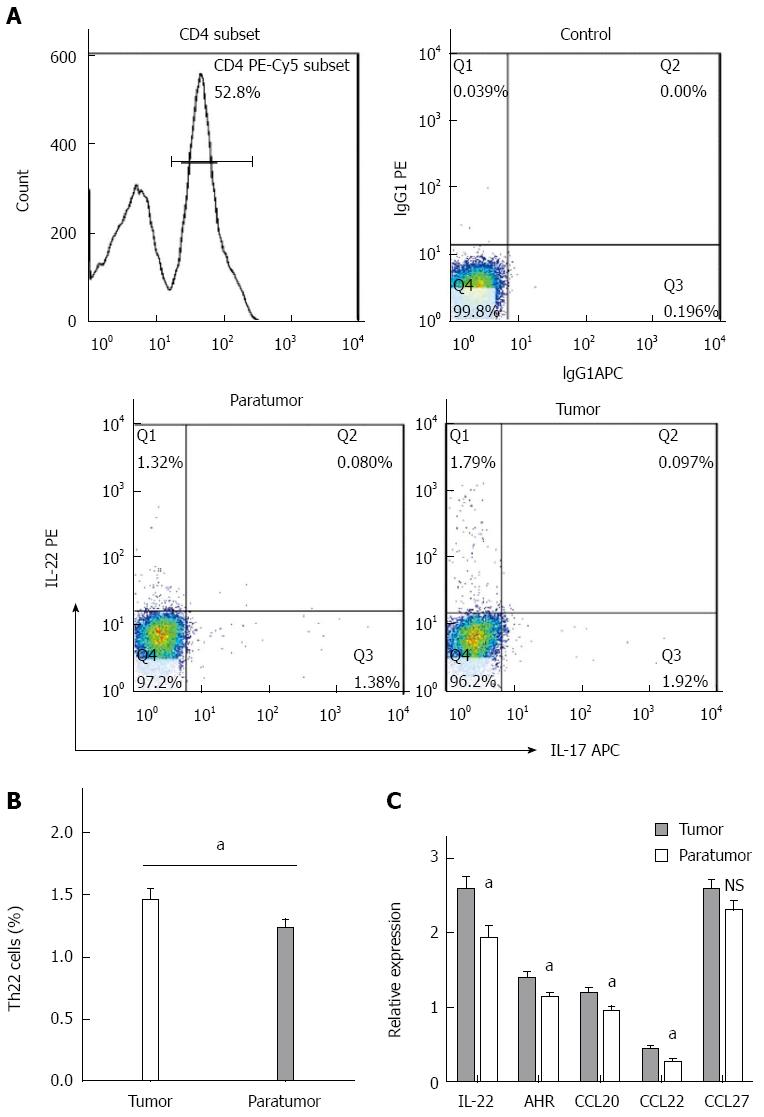
Figure 2 Expression of Th22 cells and related cytokines in colorectal cancer.
A: Gated on FSC/SSC and CD4+ subset, the proportion of Th22 cells in the CD4+ subset is presented in quadrant Q1; B: Average proportion of Th22 cells in tumor and paratumor tissues; C: Expression levels of interleukin-22, AHR, CCL20, CCL22 and CCL27 in tumor and paratumor tissues were measured by RT-qPCR. The relative expression levels were normalized to the level of β-actin mRNA for each sample. Each bar represents the mean ± SE (n = 50), aP < 0.05, tumor vs paratumor. NS: Not significant.
- Citation: Huang YH, Cao YF, Jiang ZY, Zhang S, Gao F. Th22 cell accumulation is associated with colorectal cancer development. World J Gastroenterol 2015; 21(14): 4216-4224
- URL: https://www.wjgnet.com/1007-9327/full/v21/i14/4216.htm
- DOI: https://dx.doi.org/10.3748/wjg.v21.i14.4216


