Copyright
©The Author(s) 2015.
World J Gastroenterol. Apr 7, 2015; 21(13): 3960-3969
Published online Apr 7, 2015. doi: 10.3748/wjg.v21.i13.3960
Published online Apr 7, 2015. doi: 10.3748/wjg.v21.i13.3960
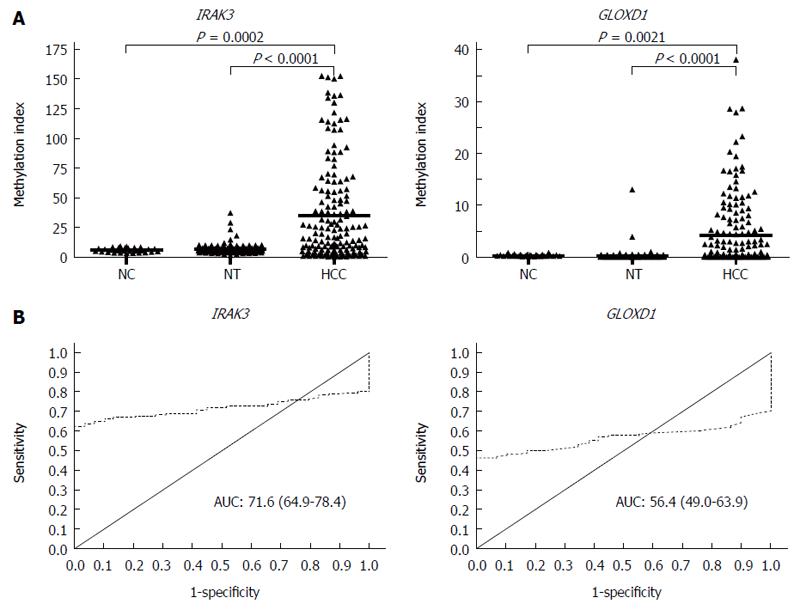
Figure 3 Methylation levels and receiver operating characteristic curve analysis of IRAK3 and GLOXD1 in liver tissues.
A: Gene methylation was determined in 29 normal controls (NC) and 160 paired hepatocellular carcinoma (HCC) tissues and their adjacent notumor tissues (NT) by quantitative methylation-specific polymerase chain reaction. The results are represented as the difference in the methylation index. The black lines indicate the mean of the methylation index. (NC vs HCC, unpaired t-test; NT vs HCC, paired t-test); B: The area under the receiver operating characteristic curve (AUC) for each gene was calculated to discriminate 29 normal individuals and 160 HCC cases.
-
Citation: Kuo CC, Shih YL, Su HY, Yan MD, Hsieh CB, Liu CY, Huang WT, Yu MH, Lin YW. Methylation of
IRAK3 is a novel prognostic marker in hepatocellular carcinoma. World J Gastroenterol 2015; 21(13): 3960-3969 - URL: https://www.wjgnet.com/1007-9327/full/v21/i13/3960.htm
- DOI: https://dx.doi.org/10.3748/wjg.v21.i13.3960


