Copyright
©The Author(s) 2015.
World J Gastroenterol. Apr 7, 2015; 21(13): 3960-3969
Published online Apr 7, 2015. doi: 10.3748/wjg.v21.i13.3960
Published online Apr 7, 2015. doi: 10.3748/wjg.v21.i13.3960
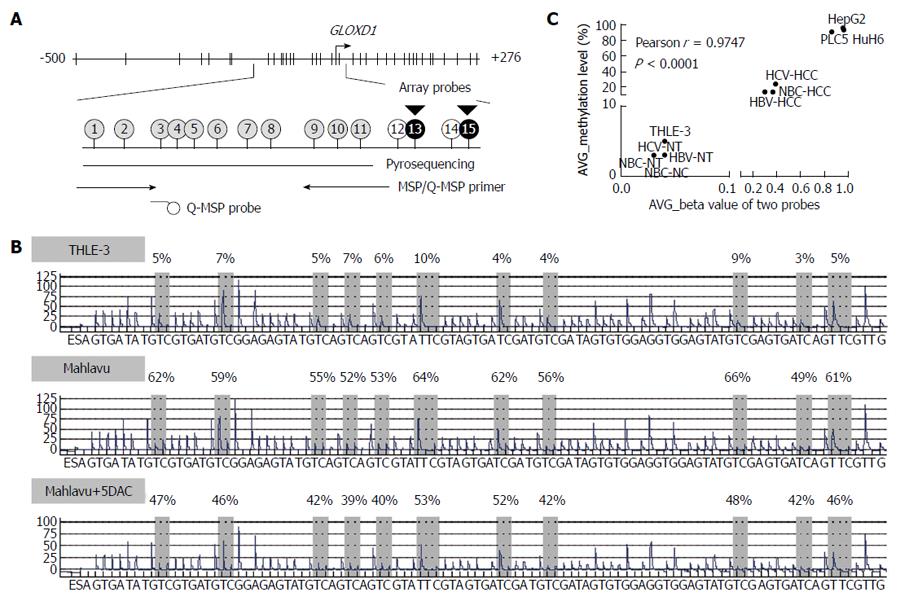
Figure 2 Map of the GLOXD1 promoter region and representative methylation pattern determined by pyrosequencing.
A: The 15 CpG sites within the GLOXD1 promoter (-500/+276) were addressed using different techniques. Two black circles indicate the 2 CpG sites recognized by probes of the methylation array chip, respectively. Eleven gray circles indicate the 11 CpG sites addressed by pyrosequencing and the 6 CpG sites that MSP/Q-MSP primer set covered (5 CpG sites for allele-specific, one CpG site for probe); B: Methylation level of 11 CpG sites addressed by pyrosequencing in THLE-3 cells, Mahlavu cells, and Mahlavu cells treated with 5DAC; C: Pearson correlation was analyzed between the average β value of two array probes and average methylation levels of the 11 CpG sites assessed by pyrosequencing in samples for methylation array, including 4 cell lines and 7 types of liver tissues.
-
Citation: Kuo CC, Shih YL, Su HY, Yan MD, Hsieh CB, Liu CY, Huang WT, Yu MH, Lin YW. Methylation of
IRAK3 is a novel prognostic marker in hepatocellular carcinoma. World J Gastroenterol 2015; 21(13): 3960-3969 - URL: https://www.wjgnet.com/1007-9327/full/v21/i13/3960.htm
- DOI: https://dx.doi.org/10.3748/wjg.v21.i13.3960


