Copyright
©The Author(s) 2015.
World J Gastroenterol. Apr 7, 2015; 21(13): 3893-3903
Published online Apr 7, 2015. doi: 10.3748/wjg.v21.i13.3893
Published online Apr 7, 2015. doi: 10.3748/wjg.v21.i13.3893
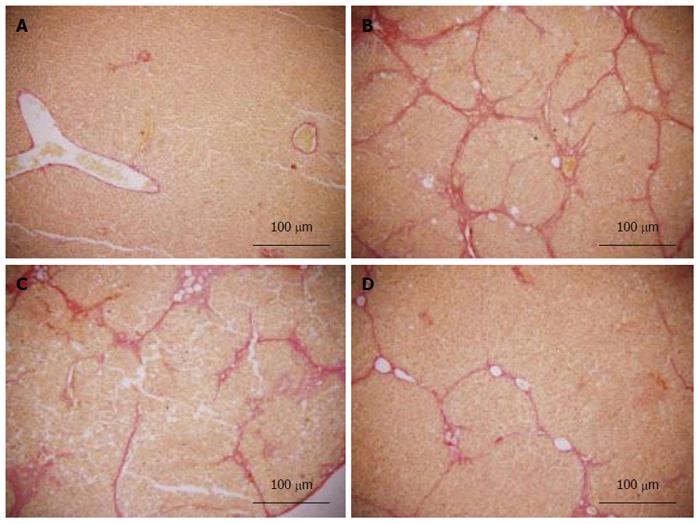
Figure 6 Van Gieson staining.
All sections were stained with van Gieson (× 100). A: Liver sections of the normal group did not show fibroplasia; B: Liver sections of the model group showed thick bundles of proliferous collagenous fibers stained with eosin and typical pseudo-lobule; C: Liver sections of the vitamin E group showed a small amount of collagenous fibers; D: Liver sections of the caffeic acid phenethyl ester (12 mg/kg) group showed a small amount of fibroplasia, which was less than that in the vitamin E group. The results of other groups are not shown here.
- Citation: Li M, Wang XF, Shi JJ, Li YP, Yang N, Zhai S, Dang SS. Caffeic acid phenethyl ester inhibits liver fibrosis in rats. World J Gastroenterol 2015; 21(13): 3893-3903
- URL: https://www.wjgnet.com/1007-9327/full/v21/i13/3893.htm
- DOI: https://dx.doi.org/10.3748/wjg.v21.i13.3893


