Copyright
©The Author(s) 2015.
World J Gastroenterol. Mar 28, 2015; 21(12): 3619-3627
Published online Mar 28, 2015. doi: 10.3748/wjg.v21.i12.3619
Published online Mar 28, 2015. doi: 10.3748/wjg.v21.i12.3619
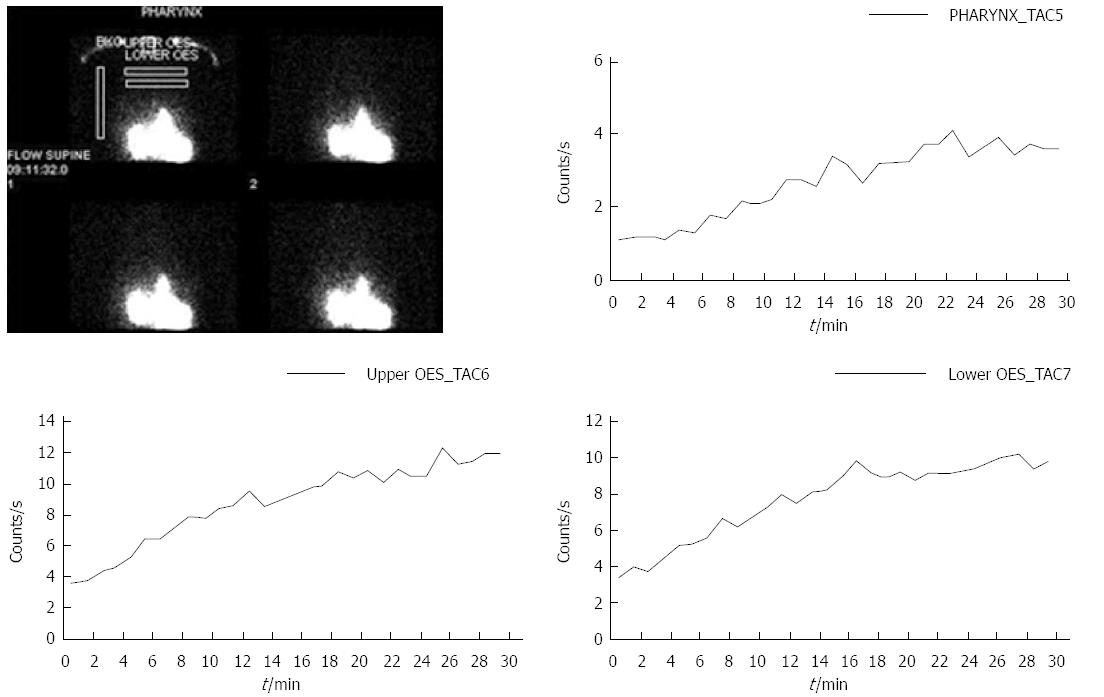
Figure 3 Full column reflux with rising time-activity curves over the pharynx, upper and lower oesophagus.
The diagram shows the typical regions of interest from which the data is derived.
- Citation: Falk GL, Beattie J, Ing A, Falk S, Magee M, Burton L, Wall HVD. Scintigraphy in laryngopharyngeal and gastroesophageal reflux disease: A definitive diagnostic test? World J Gastroenterol 2015; 21(12): 3619-3627
- URL: https://www.wjgnet.com/1007-9327/full/v21/i12/3619.htm
- DOI: https://dx.doi.org/10.3748/wjg.v21.i12.3619


